Home
Explorer of the Seas
Introduction
Institutions
Data
Observations
About the Model
Data Assimilation
Assimilation Products
Assimilation Impact
Ensemble Archives
References
Acknowledgements
Explorer of the Seas
Introduction
Institutions
Data
Observations
About the Model
Data Assimilation
Assimilation Products
Assimilation Impact
Ensemble Archives
References
Acknowledgements
Assimilation Impact
Difference Maps |
||
SST |
 |
 |
SSH |
 |
 |
Forward |
Assimilation |
|
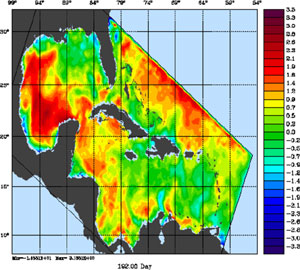
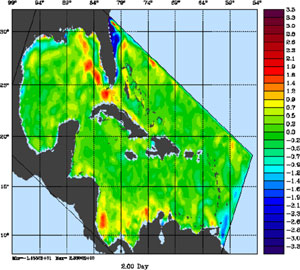
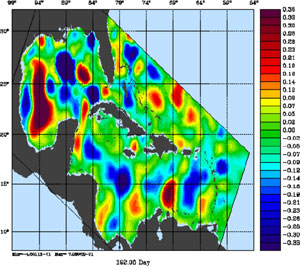
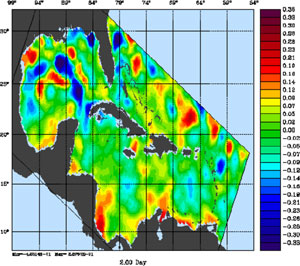
The two panels on the left show typical errors in SST and SSH (model minus observations) for the model forced with only scatterometer winds and NCEP heat fluxes (no data assimilation). The color bar range is from about +3.5C to -3.5C in SST and +0.35m to -0.35m in SSH. The panels on the right show the impact of data assimilation on the SST and SSH errors. The color bar scale is the same as on the left. These are typical errors that would exist in the model forecast initial conditions. Notice that data assimilation has reduced considerably the errors, particularly in SST.
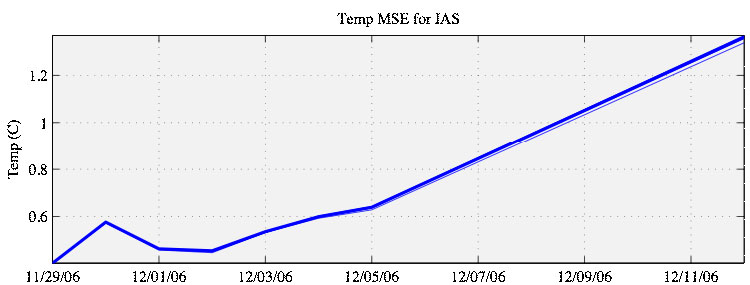
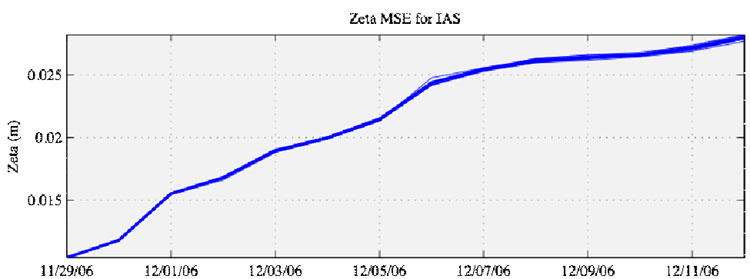
These plots show the evolution of the mean square errors (MSE) in SST (upper panel) and SSH (lower panel) during a typical 14 day forecast of the IAS. Notice how the SST forecast error remains quite low for about 1 week before the forecast starts to steadily deteriorate.