Home
Explorer of the Seas
Introduction
Institutions
Data
Observations
About the Model
Data Assimilation
Assimilation Products
Assimilation Impact
Ensemble Archives
References
Acknowledgements
Explorer of the Seas
Introduction
Institutions
Data
Observations
About the Model
Data Assimilation
Assimilation Products
Assimilation Impact
Ensemble Archives
References
Acknowledgements
Assimilation Products
- Run From 5 Jan., 2005 until 11 Apr., 2007
- 2 outer loops with 10 inner loops
- 80km horizontal & 100m vertical length scales
- Initial first-guess from model spin-up
- Unbalanced
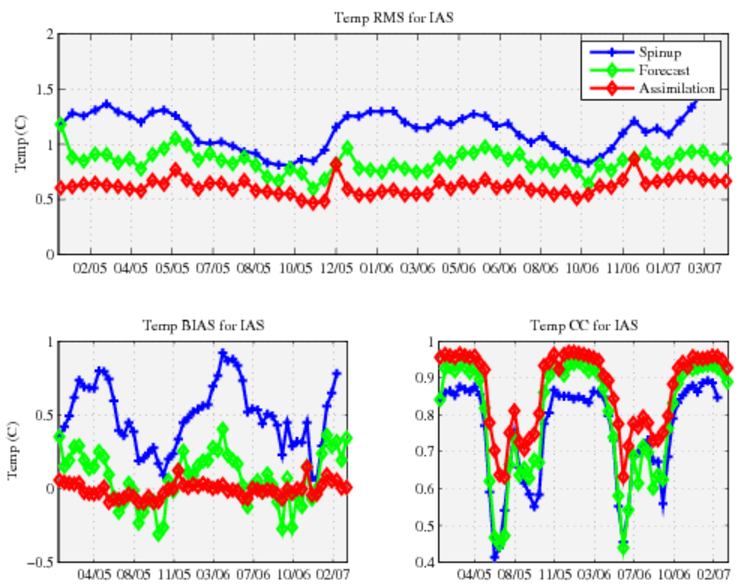
The above plot summarizes the model forecast skill for the period January 2005 into April 2007. The top panel shows the model root mean square error (RMS) in SST for the entire IAS region.
Blue curve: RMS of the model forced only by scatterometer winds and NCEP forcing - no data assimilation.
Green curve: RMS of 14 day forecasts launched from model states forced by scatterometer winds and NCEP forcing and in which satellite SST, SSH and Explorer ADCP current data have been assimilated.
Red curve: RMS during each 14 day assimilation cycle used to generate the 14 day forecasts shown in the green curve.
The difference between the green and red curves shows how much the forecast error increases over 14 days.
The lower panels shows the mean SST bias (lower left) and SST pattern correlation (lower right) compared to the satellite observations for the same three cases. Notice how data assimilation dramatically reduces the bias, and consistently elevates the pattern correlation.
Some statistics:
- Mean Assimilation RMS: 0.62 C
- Mean Assimilation Bias: -0.009 C
- Mean Forecast Bias: 0.08
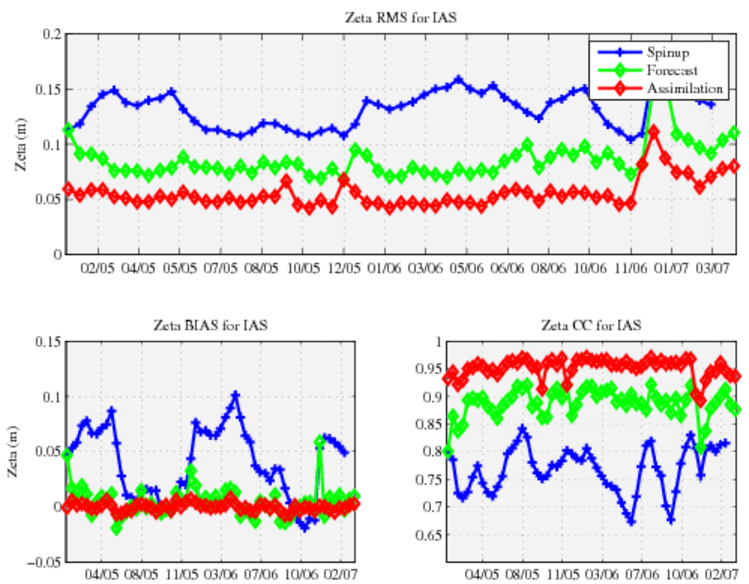
In this plot, the top panel shows the model root mean square error (RMS) in SSH for the entire IAS region.
Blue curve: RMS of the model forced only by scatterometer winds and NCEP forcing - no data assimilation.
Green curve: RMS of 14 day forecasts launched from model states forced by scatterometer winds and NCEP forcing and in which satellite SST, SSH and Explorer ADCP current data have been assimilated.
Red curve: RMS during each 14 day assimilation cycle used to generate the 14 day forecasts shown in the green curve.
The difference between the green and red curves shows how much the forecast error increases over 14 days.
The lower panels shows the mean SSH bias (lower left) and SSH pattern correlation (lower right) compared to the satellite observations for the same three cases. Notice how data assimilation dramatically reduces the bias, and consistently elevates the pattern correlation.
Some statistics:
- Mean Assimilation RMS: 5.7cm
- Mean Assimilation Bias: <1mm
- Mean CC: 0.95
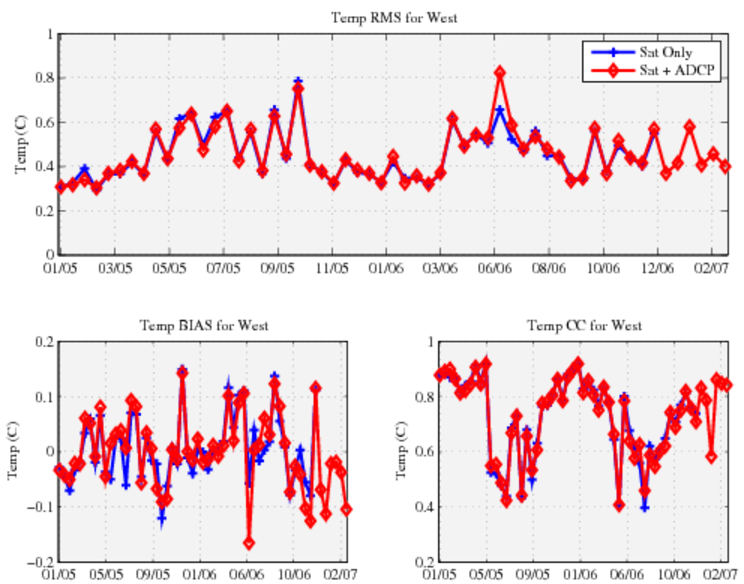
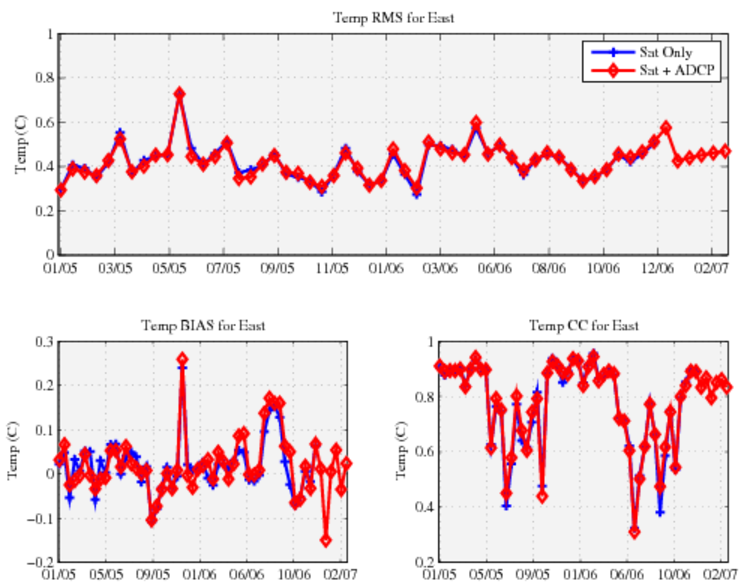
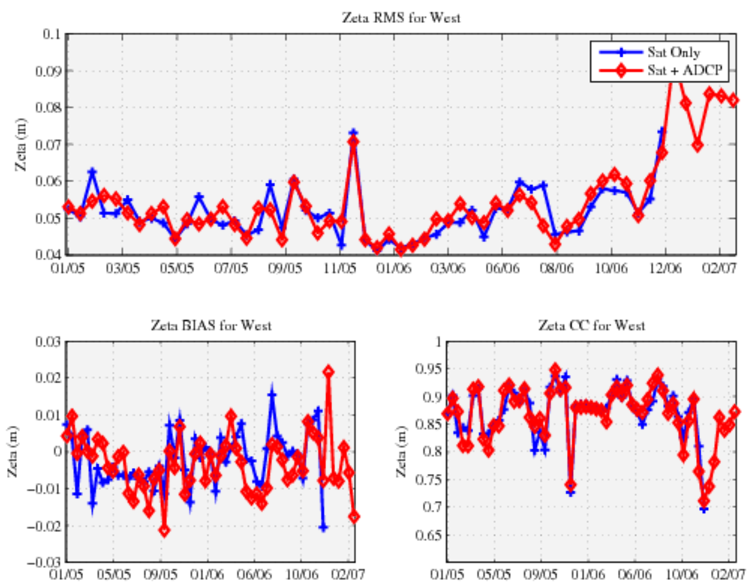
These figures show the impact on model errors during the data assimilation cycle of assimilating ADCP current data from Explorer in addition to satellite SST and SSH. The upper set of figures show the western cruise track of the Explorer of the Seas and the lower set shows the eastern cruise track. The top panel of each figure shows the RMS in SST using satellite data only (blue curve) and satellite data + ADCP data (red curve). The lower panels show the bias in SST and pattern correlations in SST in these same two experiments.
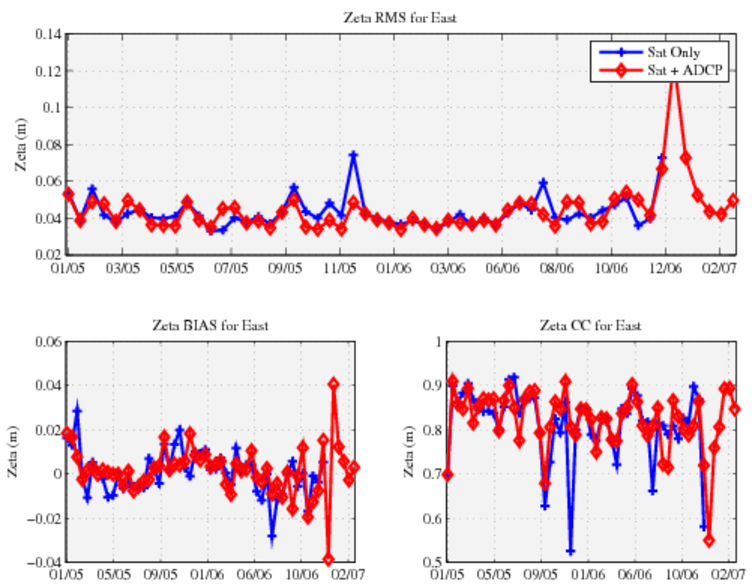
These figures show the impact on model errors during the data assimilation cycle of assimilating ADCP current data from Explorer in addition to satellite SST and SSH. The upper set of figures show the western cruise track of the Explorer of the Seas and the lower set shows the eastern cruise track. The top panel shows the RMS in SSH using satellite data only (blue curve) and satellite data + ADCP data (red curve). The lower panels show the bias in SSH and pattern correlations in SSH in these same two experiments.