File list
From WikiROMS
Jump to navigationJump to search
This special page shows all uploaded files.
| Date | Name | Thumbnail | Size | User | Description | Versions |
|---|---|---|---|---|---|---|
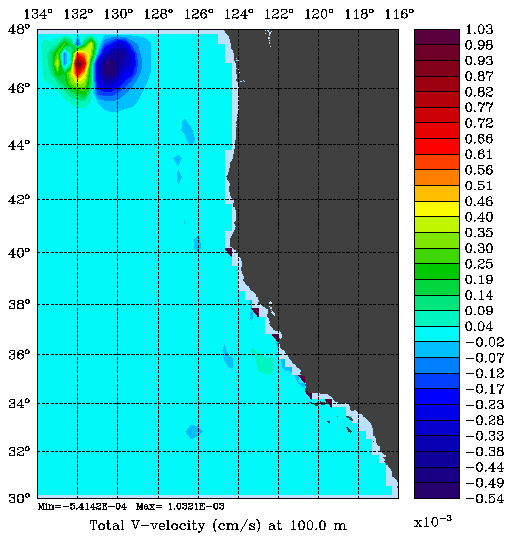
| 21:20, 30 June 2010 | psas posterior EOF v.png (file) |  |
21 KB | Robertson | 1 | |
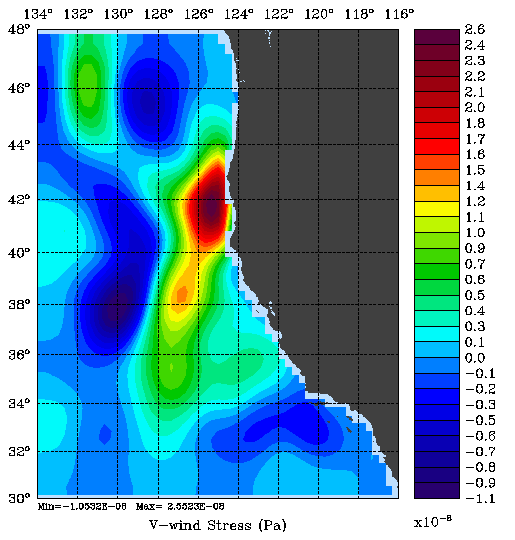
| 21:19, 30 June 2010 | psas posterior EOF vwind.png (file) |  |
30 KB | Robertson | 1 | |
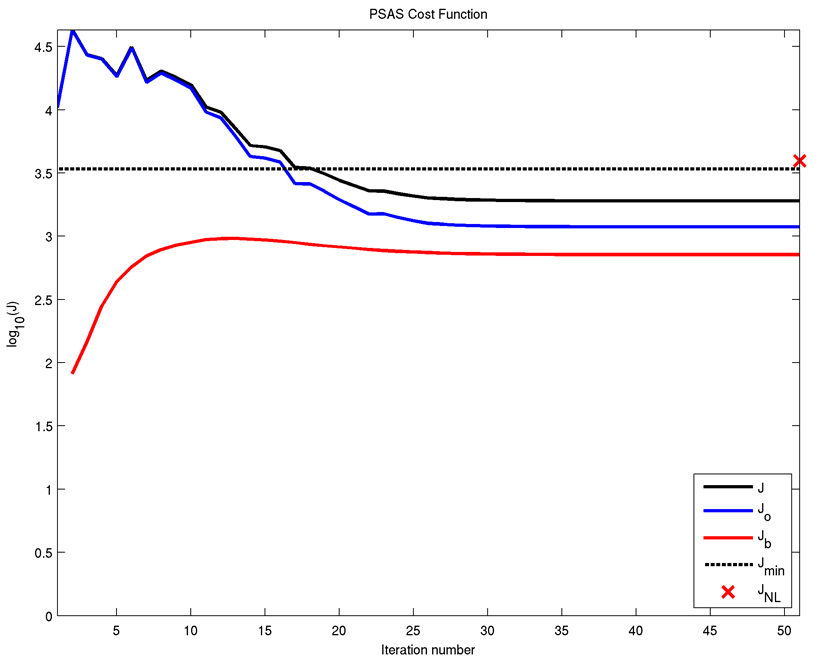
| 21:19, 30 June 2010 | psas cost.png (file) |  |
37 KB | Robertson | 1 | |
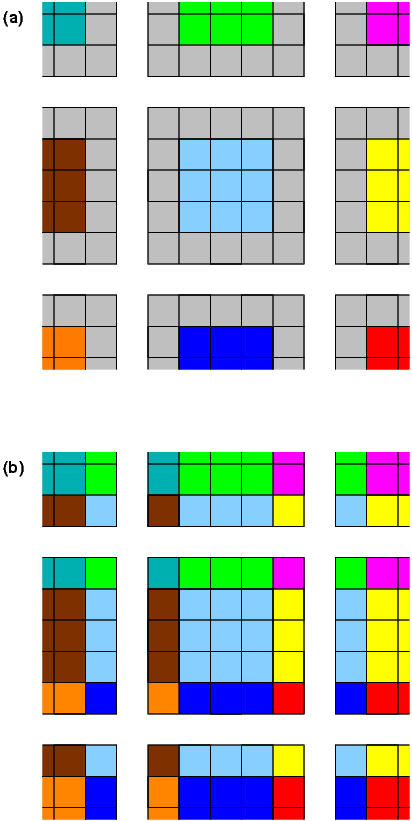
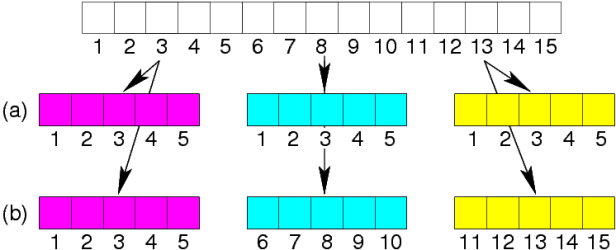
| 20:36, 12 November 2009 | Exchange 2d.png (file) |  |
7 KB | Kate | Halo exchange, with out-of-date halo points in grey (a) before the exchange, (b) after the exchange. | 1 |
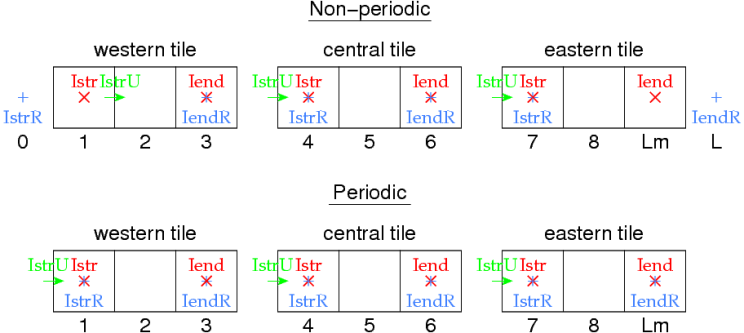
| 20:30, 12 November 2009 | Istr.png (file) |  |
50 KB | Kate | Starting and ending indices for tiling. | 1 |
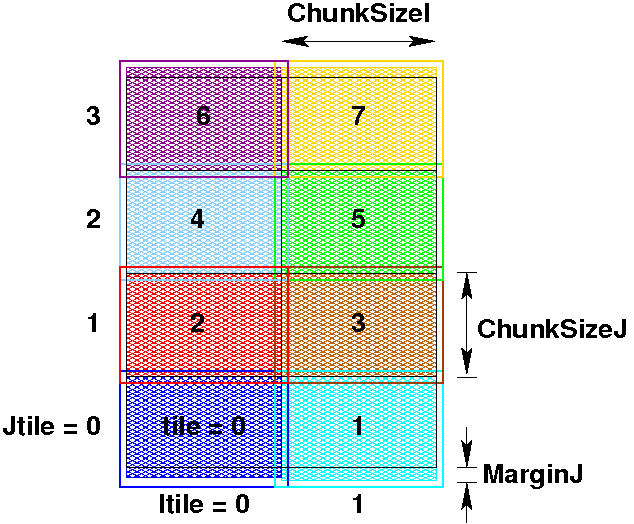
| 20:27, 12 November 2009 | Index numbering.png (file) |  |
26 KB | Kate | Shows two common choices for numbering grids within a decomposed tile. | 1 |
| 20:14, 12 November 2009 | Tile3.png (file) |  |
18 KB | Kate | Shows some internal ROMS tile numbers. | 1 |
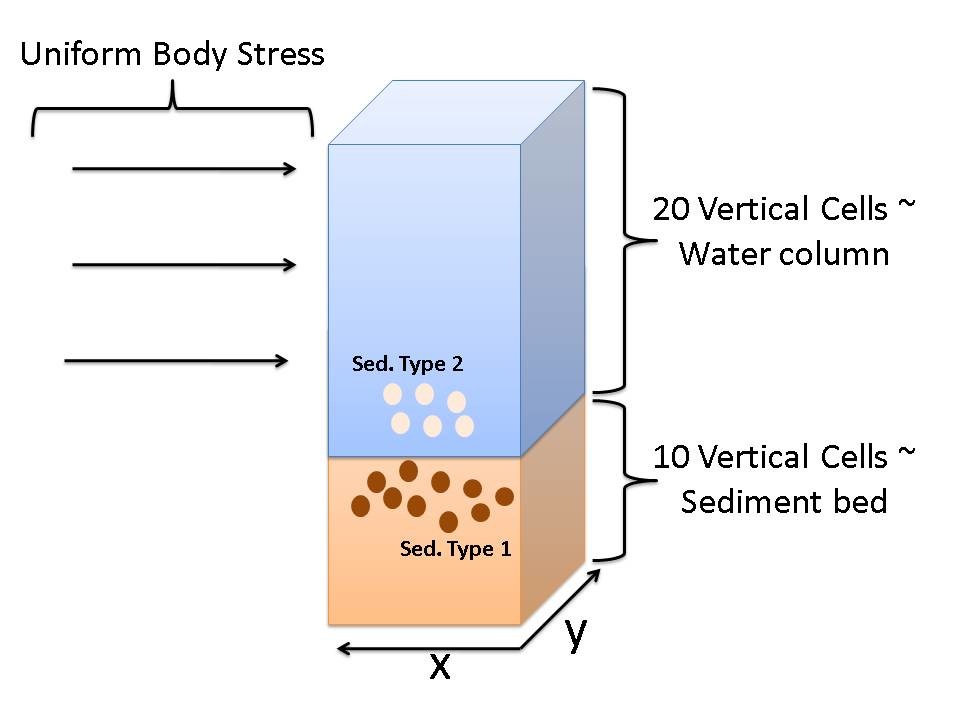
| 20:24, 19 October 2009 | sed toy.jpg (file) |  |
70 KB | Ckharris | Sed_Toy Vertical Grid schematic | 1 |
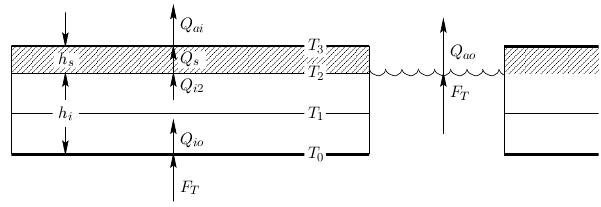
| 22:39, 22 September 2009 | Ice diag2.png (file) |  |
8 KB | Kate | Ice heat flux diagram with Q_x variables. | 1 |
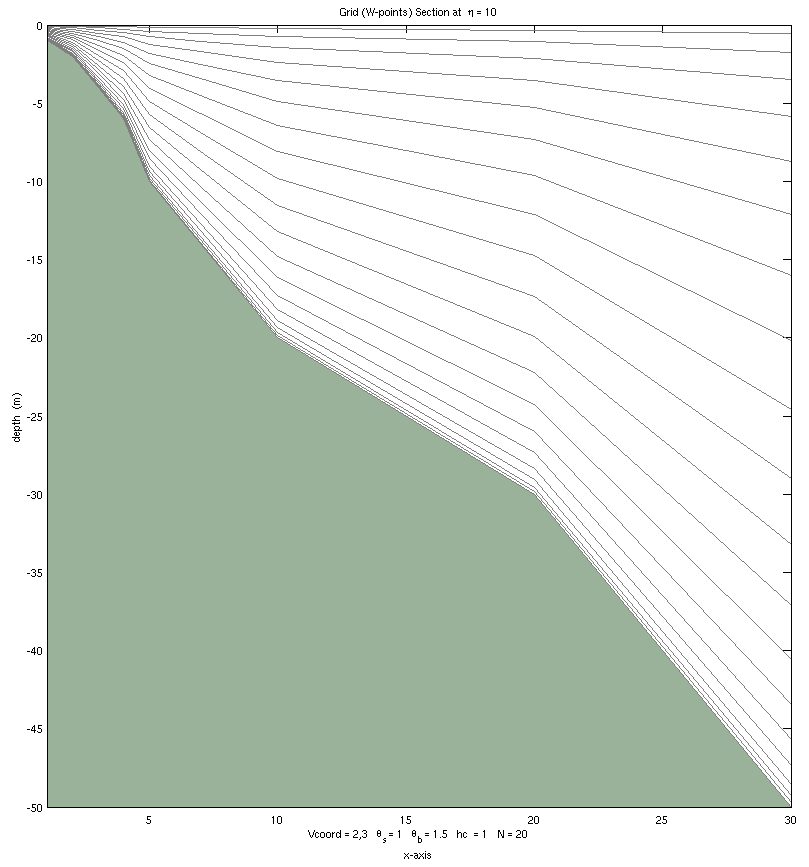
| 23:38, 5 March 2009 | shelf 23 a.png (file) |  |
11 KB | Arango | Shallow shelf, Vtransform=2, Vstretching=3, theta_s=1.0, theta_b=1.5 | 1 |
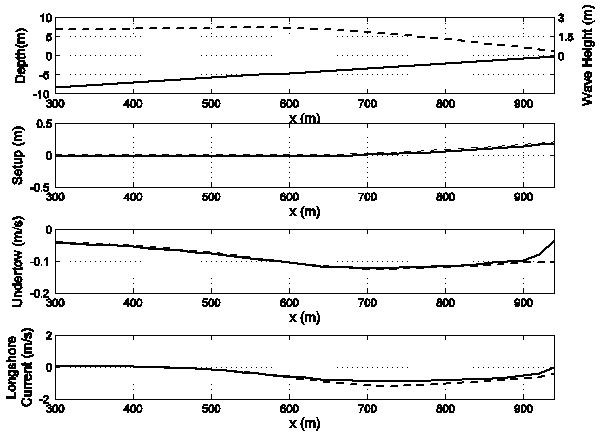
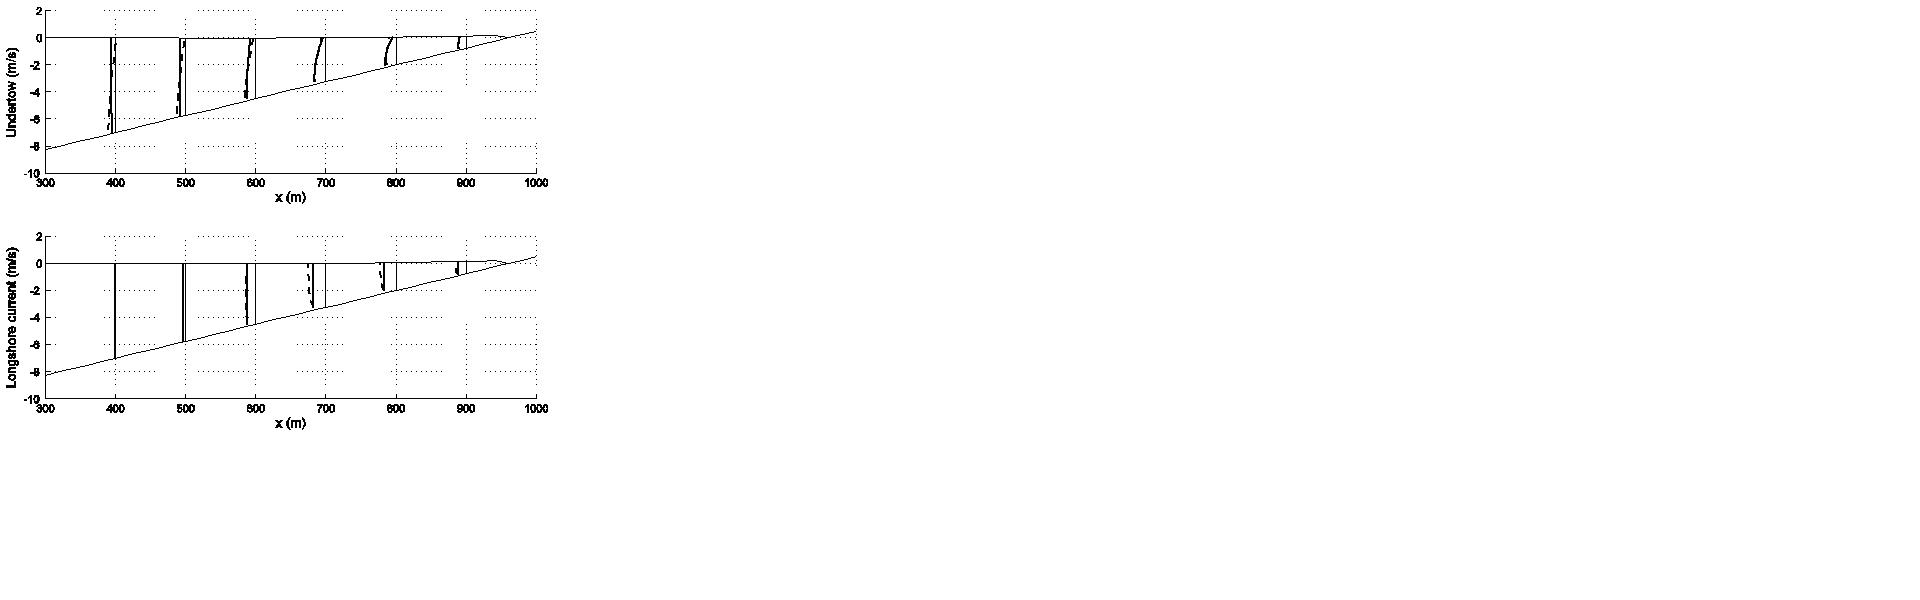
| 20:15, 5 February 2009 | shoreface fig1.jpg (file) |  |
58 KB | Robertson | Cropped out the extra white space | 2 |
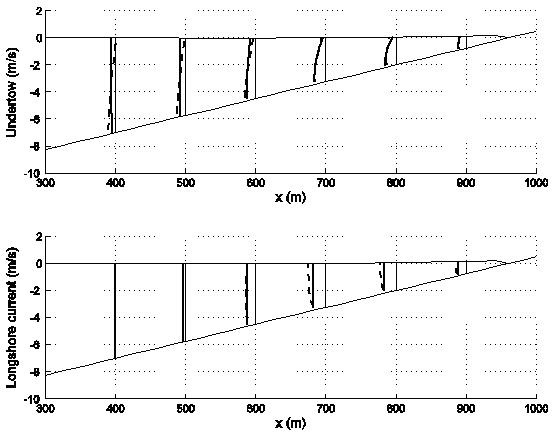
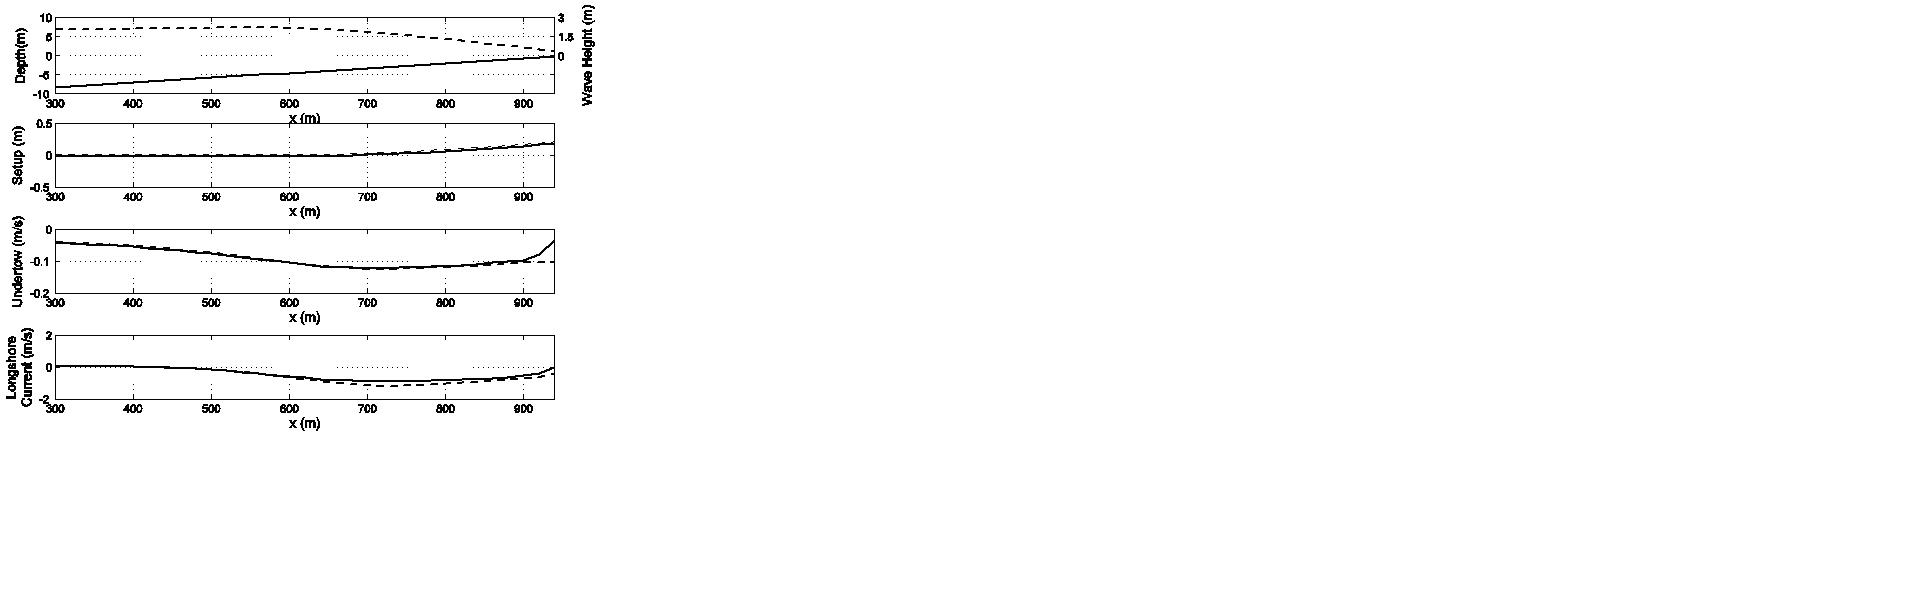
| 20:14, 5 February 2009 | shoreface fig2.jpg (file) |  |
52 KB | Robertson | Cropped out the extra white space | 2 |
| 19:51, 5 February 2009 | SHOREFACE hishis.nc (file) | 5.24 MB | Robertson | 1 | ||
| 21:30, 3 February 2009 | Shoreface fig2.jpg (file) |  |
52 KB | Jcwarner | 1 | |
| 21:30, 3 February 2009 | Shoreface fig1.jpg (file) |  |
60 KB | Jcwarner | 1 | |
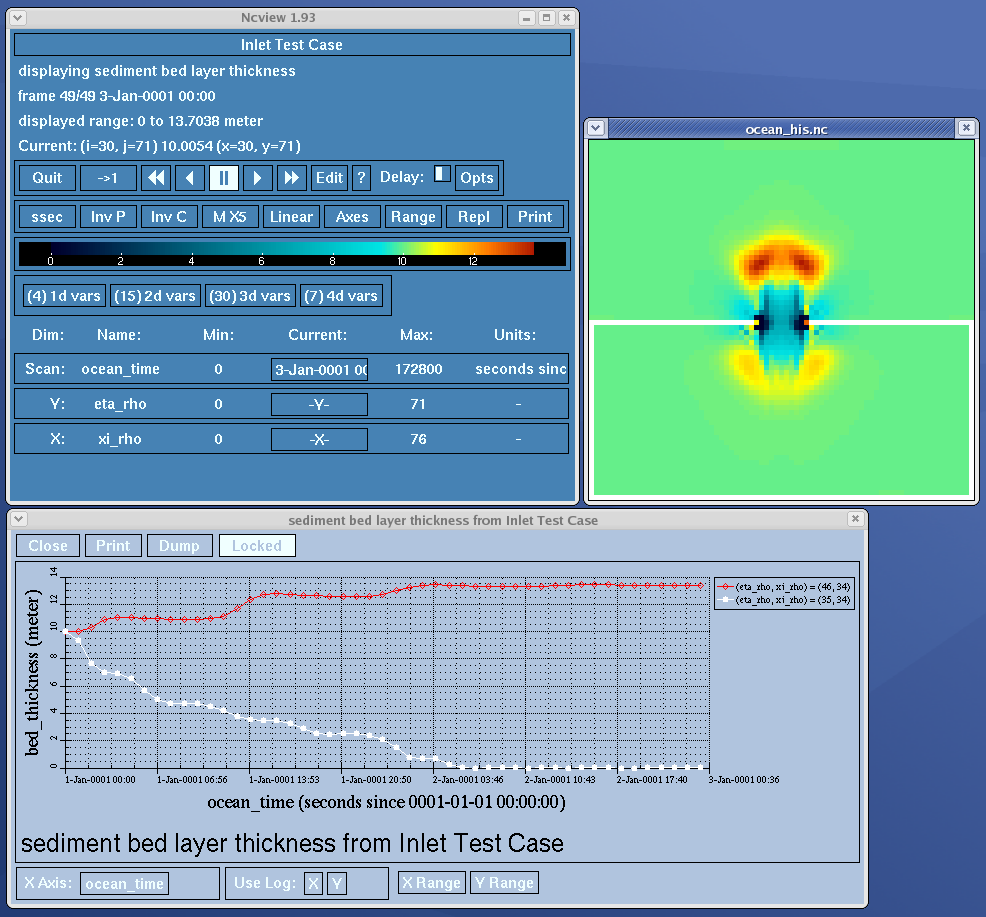
| 16:33, 13 January 2009 | Inlet test final bed.png (file) |  |
82 KB | Rsignell | 4 | |
| 16:30, 13 January 2009 | Inlet test config.zip (file) | 4.16 MB | Rsignell | 3 | ||
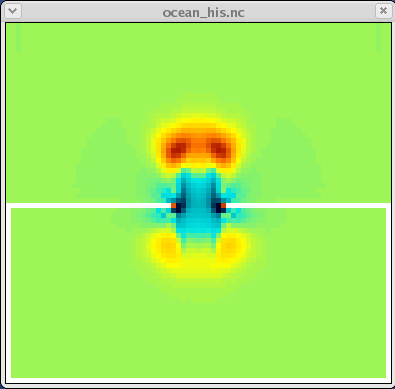
| 17:03, 9 January 2009 | Inlet test final bed small.png (file) |  |
6 KB | Rsignell | 1 | |
| 16:39, 9 January 2009 | INLET TEST SVN R291 Ocean his.nc (file) | 50.76 MB | Rsignell | INLET_TEST output file (ocean_his.nc) from ROMS SVN Version 291 | 1 | |
| 18:30, 4 November 2008 | cost fig6.png (file) |  |
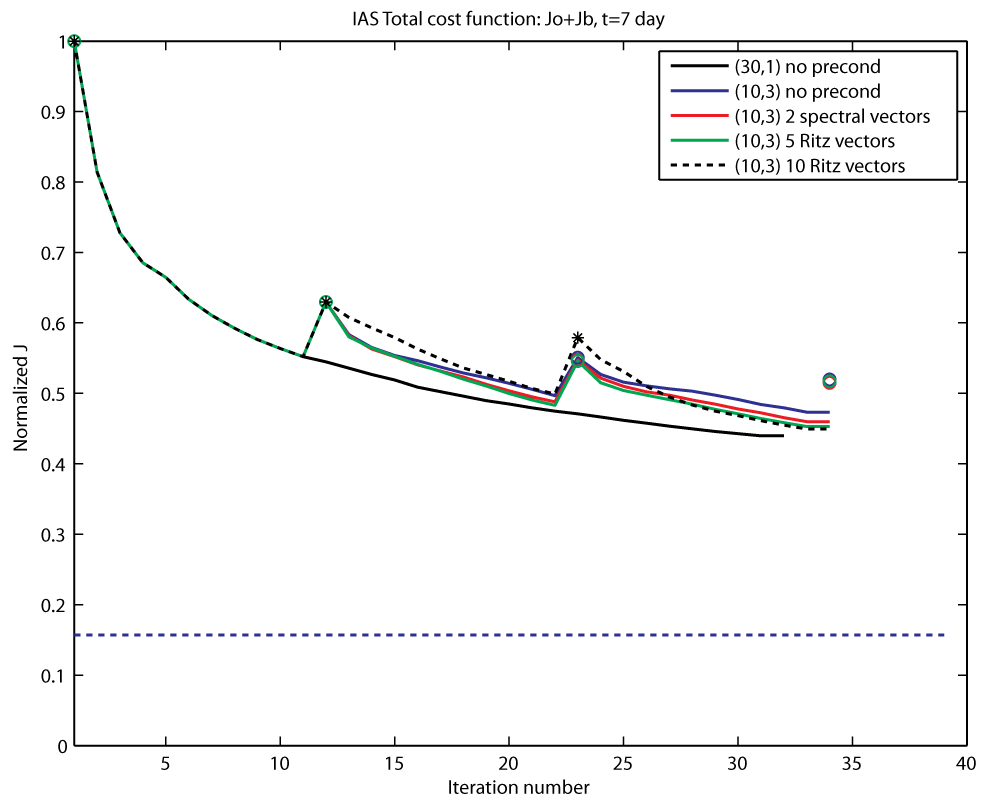
20 KB | Robertson | The normalized cost function J computed within inner-loops (curves) and JNL the cost function computed relative to the nonlinear model during outer-loops (open circles). The various cases shown are for a 7-day assimilation window: (30,1) no preconditionin | 1 |
| 18:30, 4 November 2008 | cost fig5.png (file) |  |
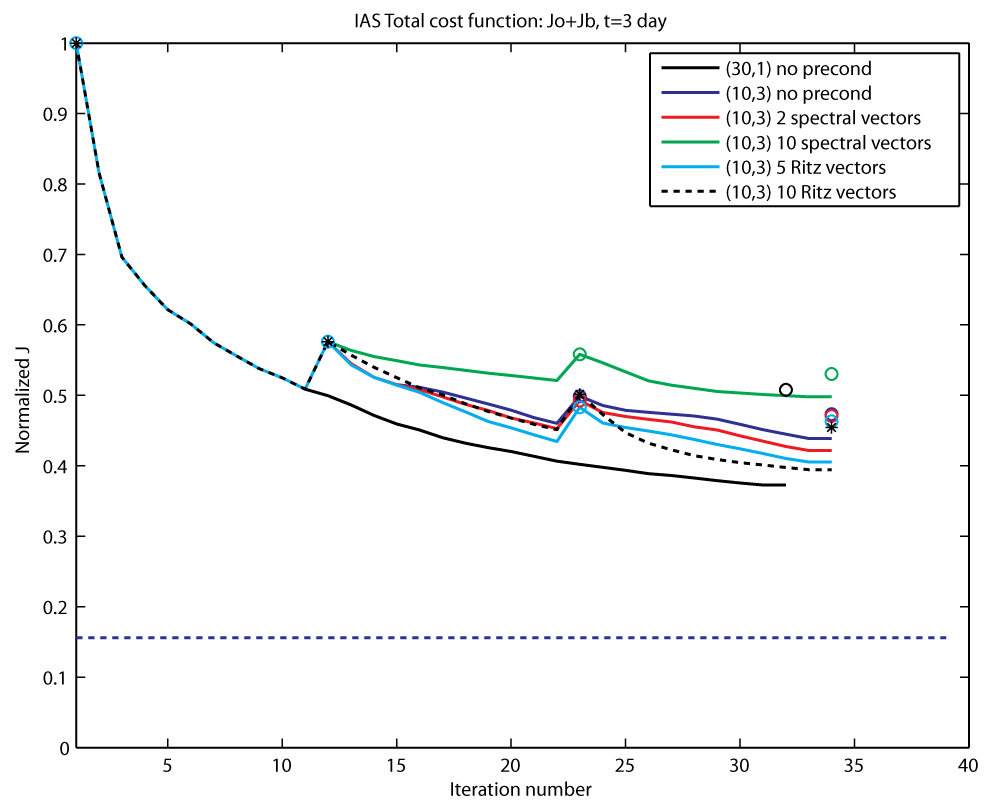
23 KB | Robertson | The normalized cost function J computed within inner-loops (curves) and JNL the cost function computed relative to the nonlinear model during outer-loops (open circles). The various cases shown are for a 3-day assimilation window: (30,1) no preconditionin | 1 |
| 18:29, 4 November 2008 | cost fig4.png (file) |  |
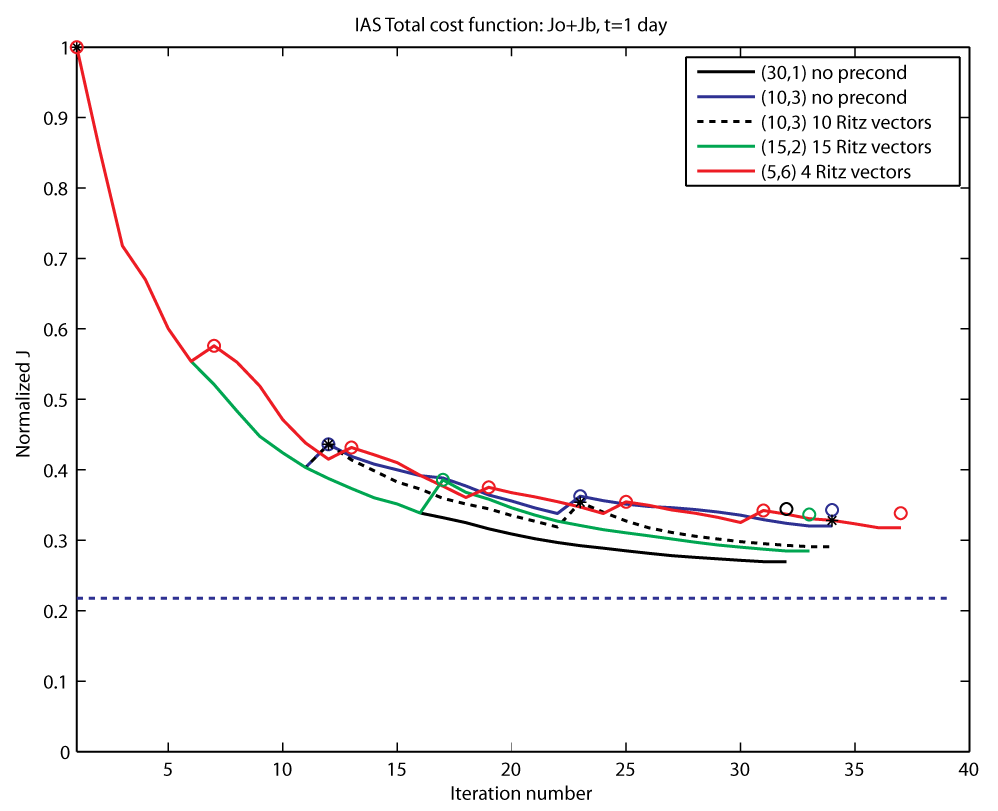
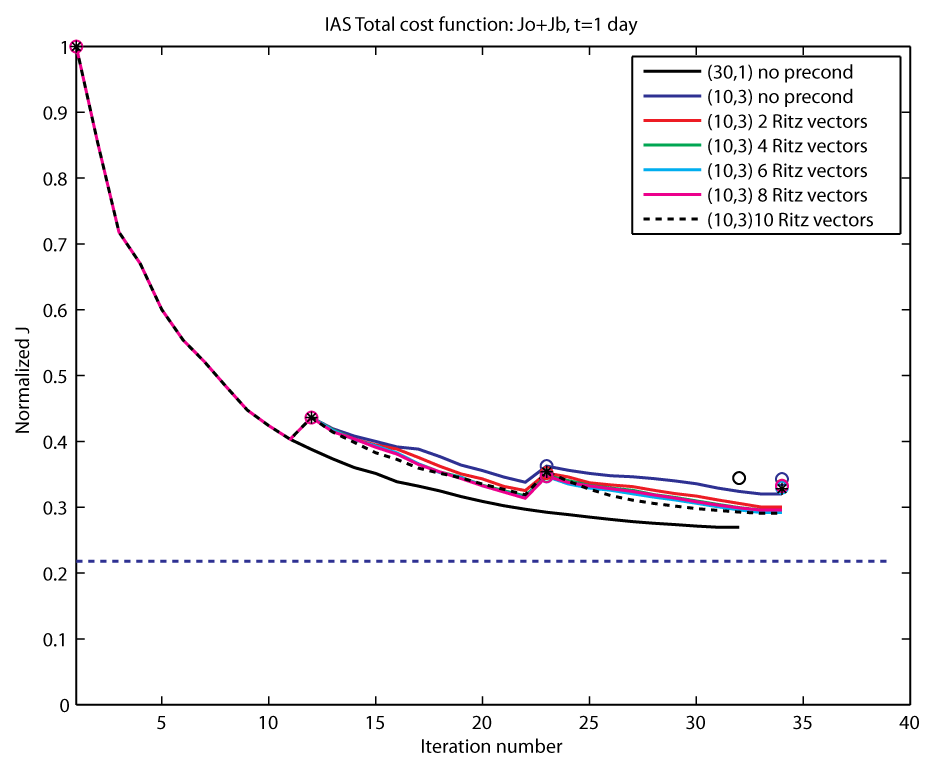
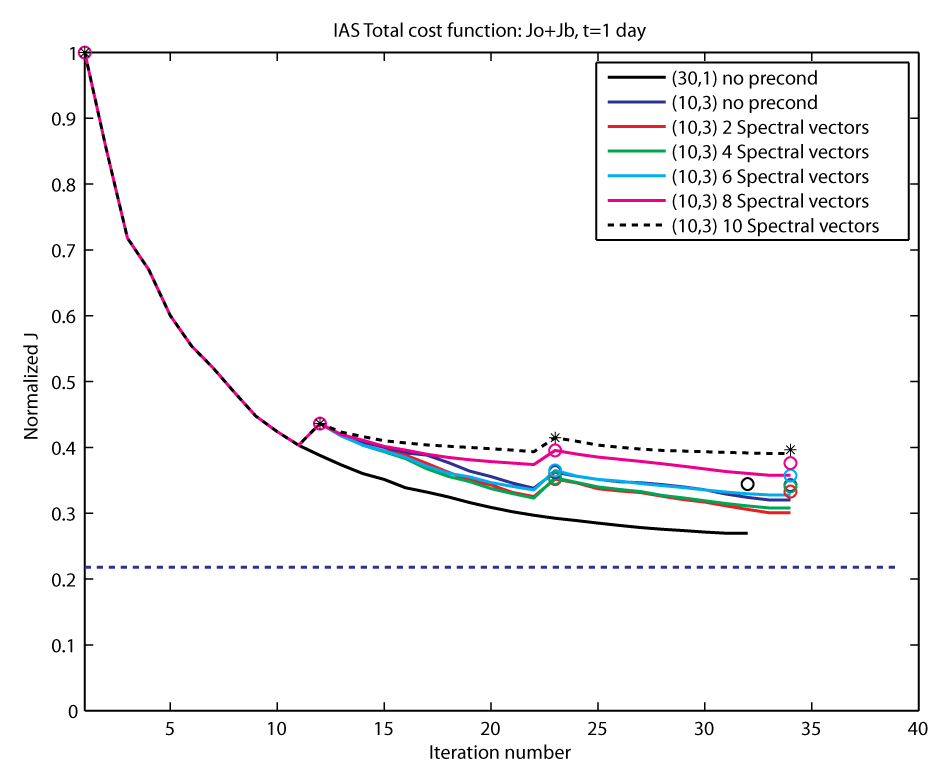
21 KB | Robertson | The normalized cost function J computed within inner-loops (curves) and JNL the cost function computed relative to the nonlinear model during outer-loops (open circles). The various cases shown are for a 1-day assimilation window: (30,1) no preconditionin | 1 |
| 18:28, 4 November 2008 | cost fig3.png (file) |  |
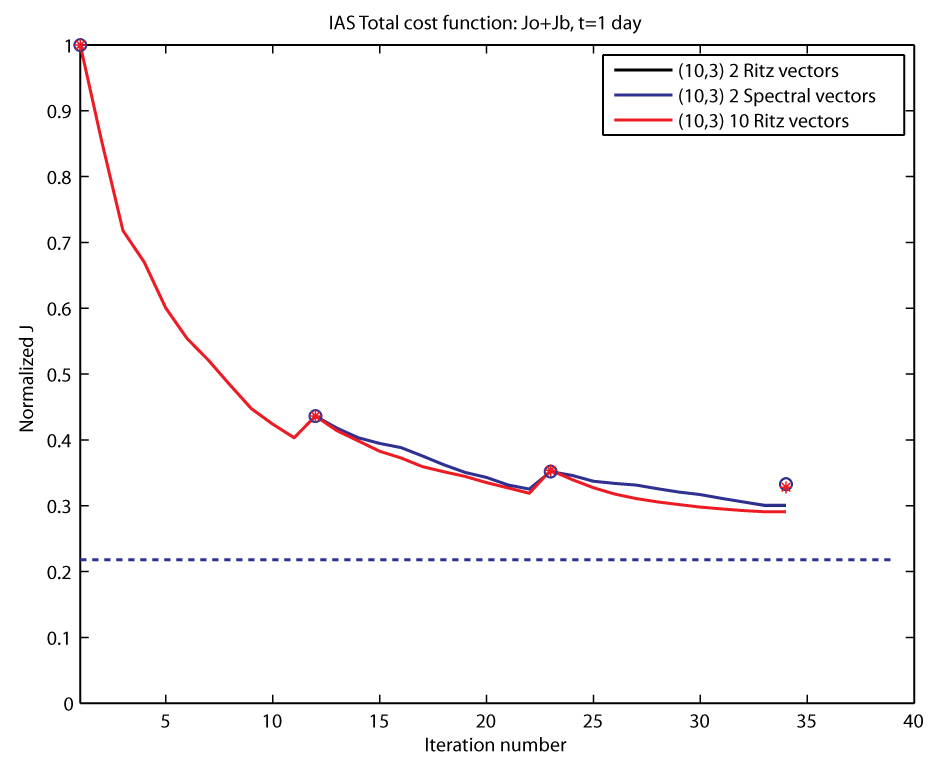
15 KB | Robertson | The normalized cost function J computed within inner-loops (curves) and JNL the cost function computed relative to the nonlinear model during outer-loops (open circles). The various cases shown are for a 1-day assimilation window: (10,3) and Ritz precondi | 1 |
| 18:27, 4 November 2008 | cost fig2.png (file) |  |
22 KB | Robertson | The normalized cost function J computed within inner-loops (curves) and J<sub>NL</sub> the cost function computed relative to the nonlinear model during outer-loops (open circles). | 1 |
| 18:26, 4 November 2008 | cost fig1.png (file) |  |
23 KB | Robertson | The normalized cost function J computed within inner-loops (curves), and JNL the cost function computed relative to the nonlinear model during outer-loops (open circles). | 1 |
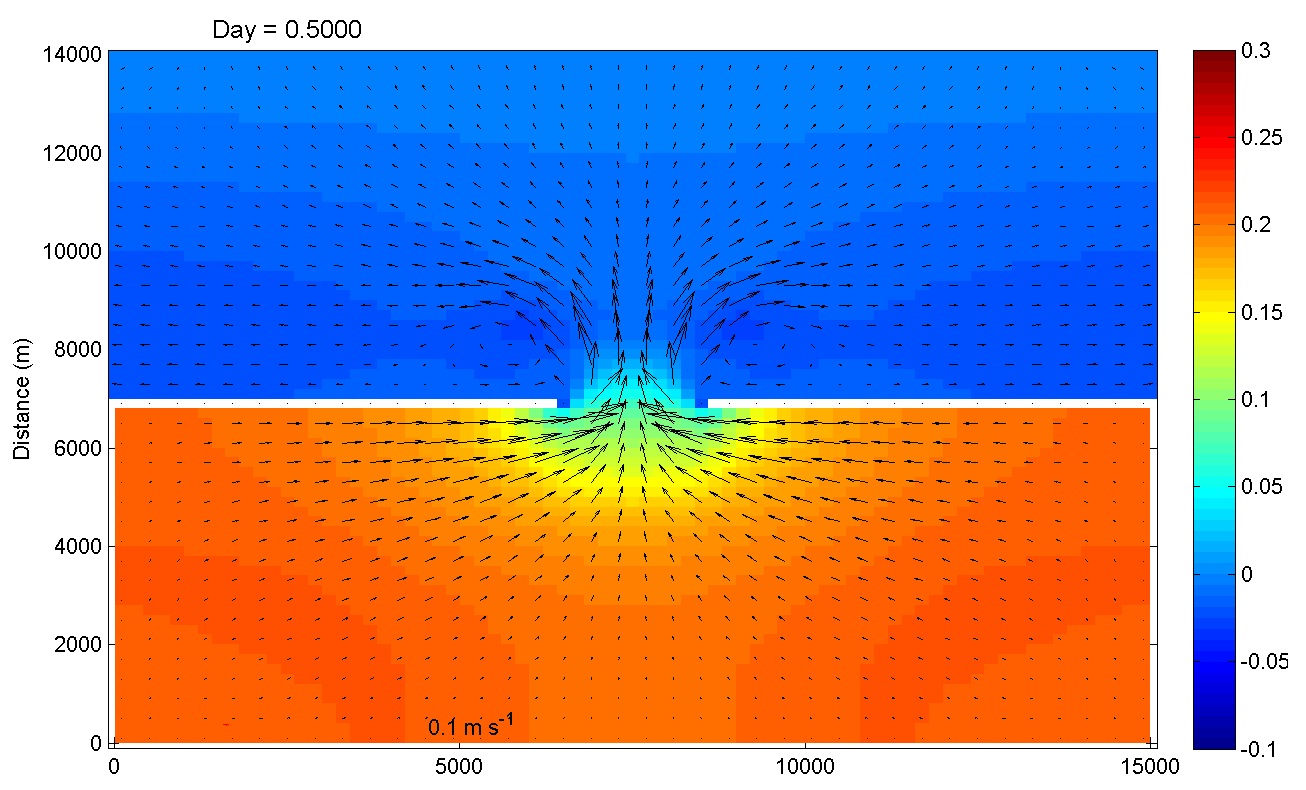
| 18:16, 28 October 2008 | Inlet test zeta day0.5.png (file) |  |
29 KB | Robertson | cropped the original | 2 |
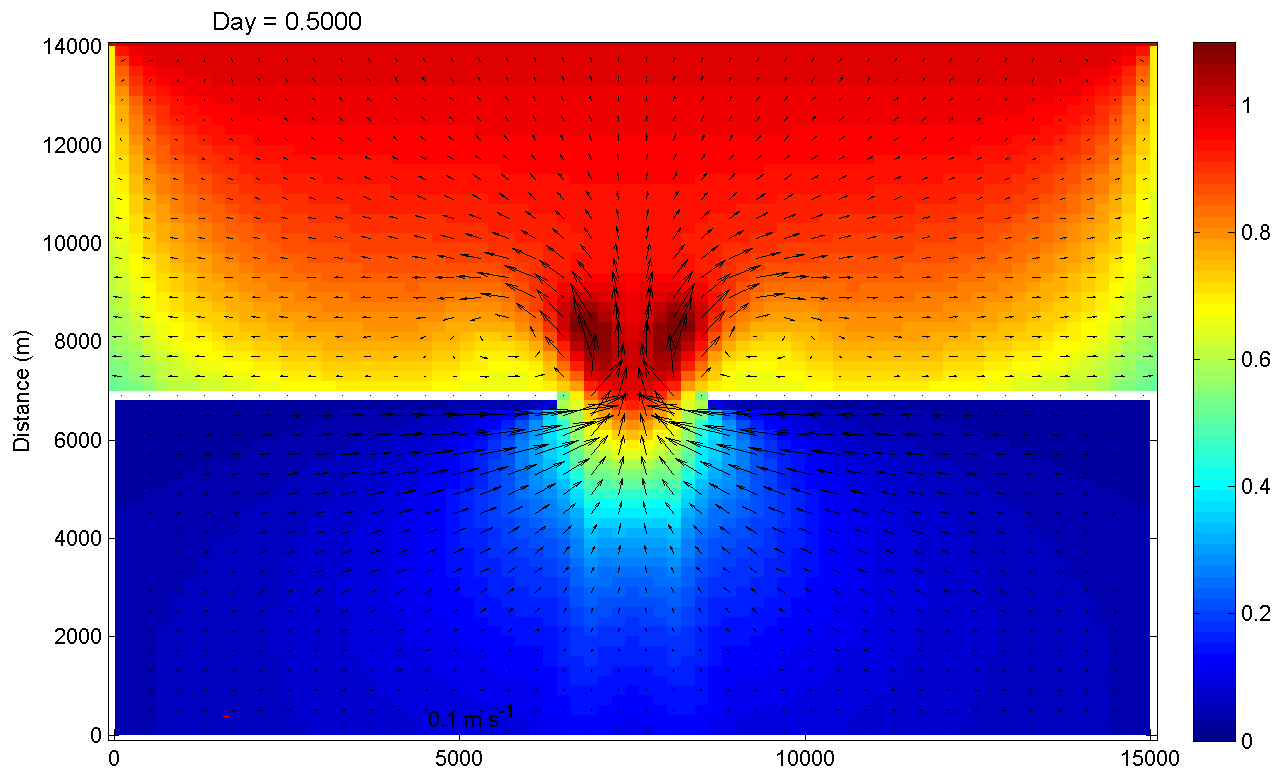
| 18:15, 28 October 2008 | Inlet test Hwave day0.5.png (file) |  |
36 KB | Robertson | 2 | |
| 13:42, 28 October 2008 | Inlet test table setup.JPG (file) |  |
23 KB | Jcwarner | 1 | |
| 01:04, 12 September 2008 | Shortstep.png (file) |  |
3 KB | Kate | Short time step diagram | 1 |
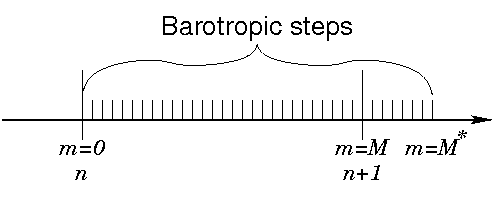
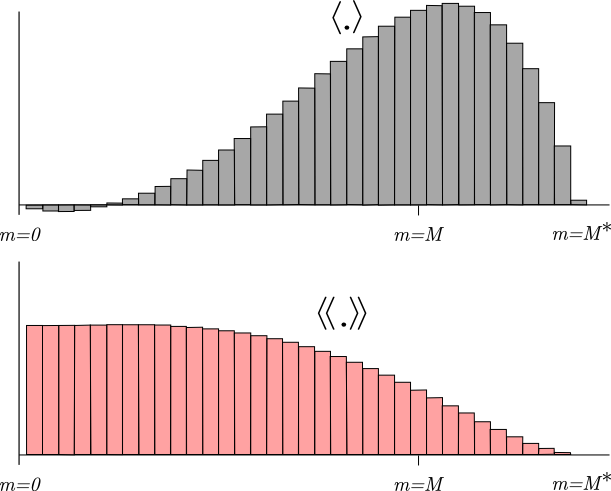
| 00:59, 12 September 2008 | Barostep.png (file) |  |
24 KB | Kate | Barotropic time step weights | 1 |
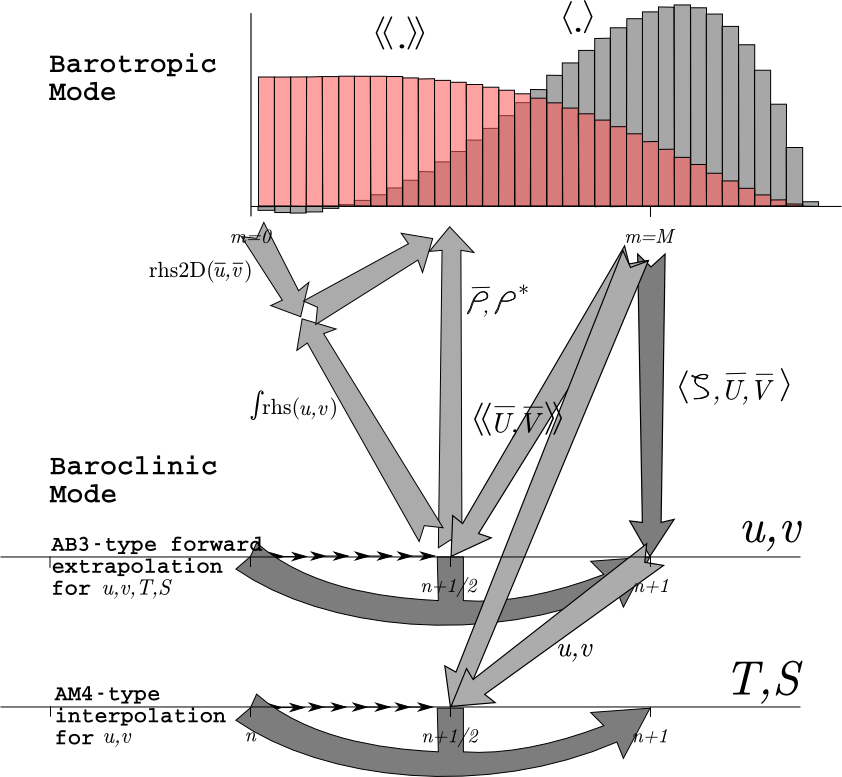
| 01:03, 27 August 2008 | Timestep 4.png (file) |  |
122 KB | Kate | From Sasha's 2008a paper, timestepping diagram for non-hydrostatic ROMS. | 1 |
| 01:02, 27 August 2008 | Timestep 3.png (file) |  |
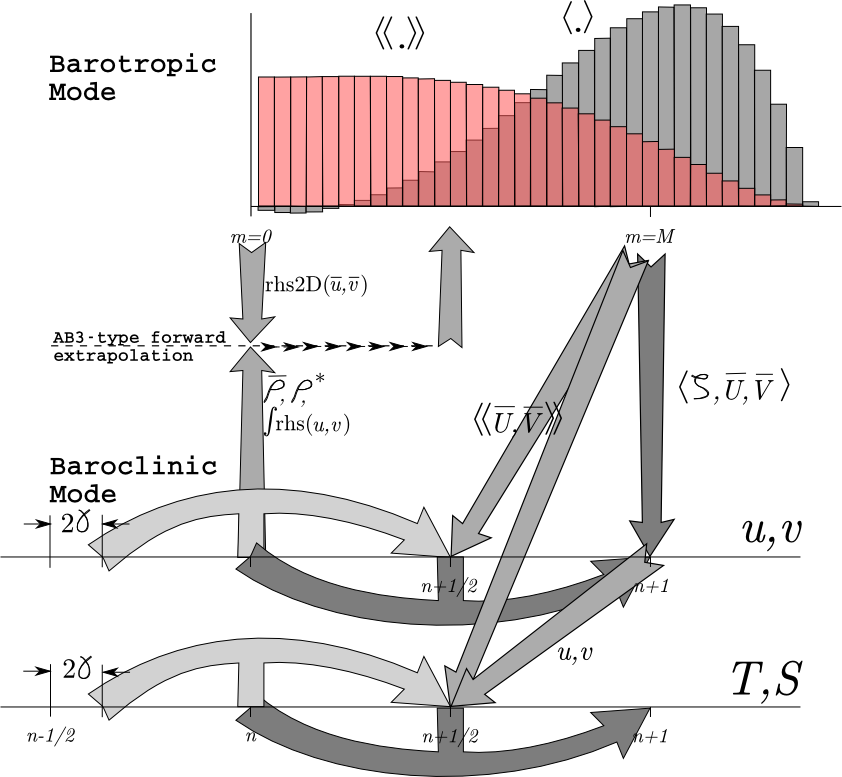
127 KB | Kate | From Sasha's 2008a paper, timstepping diagram for ROMS UCLA. | 1 |
| 01:01, 27 August 2008 | Timestep 2.png (file) |  |
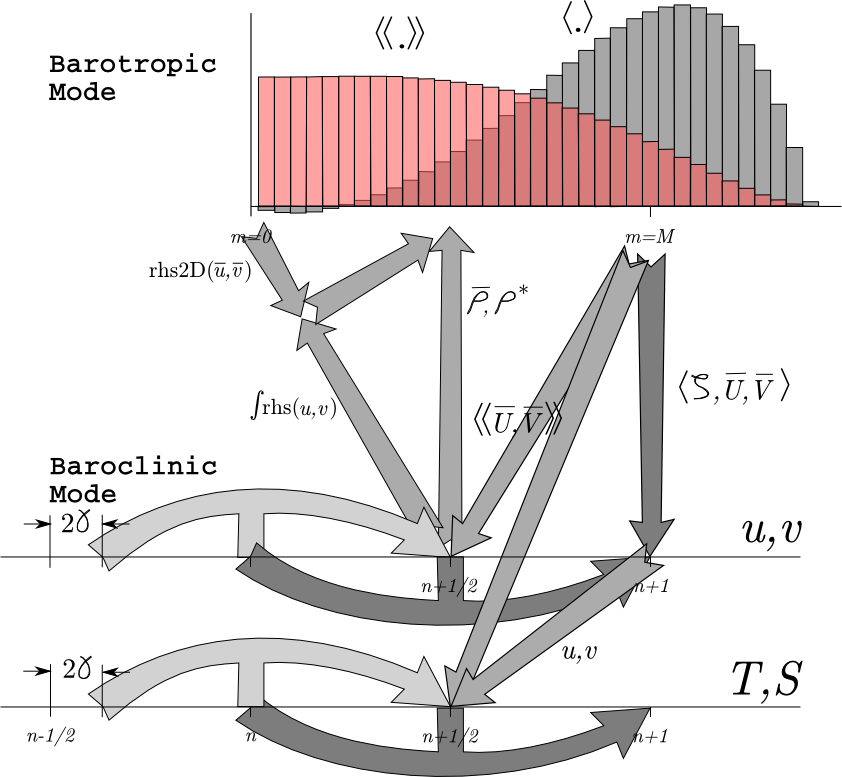
124 KB | Kate | From Sasha's 2008a paper, ROMS-AGRIF timestepping diagram. | 1 |
| 01:00, 27 August 2008 | Timestep 1.png (file) |  |
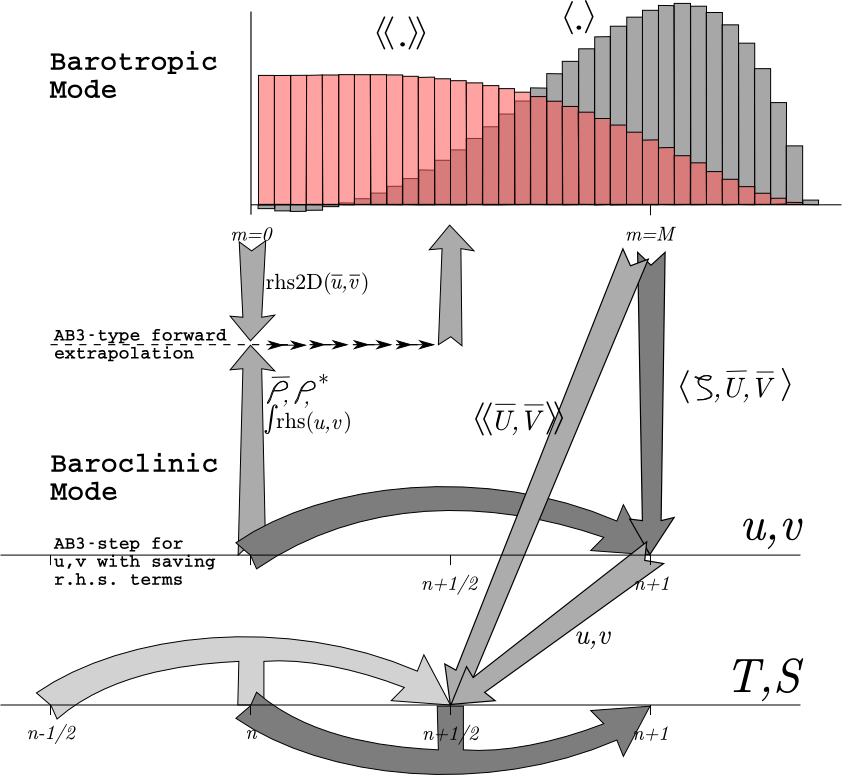
112 KB | Kate | From Sasha's 2008a paper, Rutgers ROMS timestep diagram. | 1 |
| 21:30, 22 July 2008 | Mask2.gif (file) |  |
6 KB | Kate | Land mask diagram | 1 |
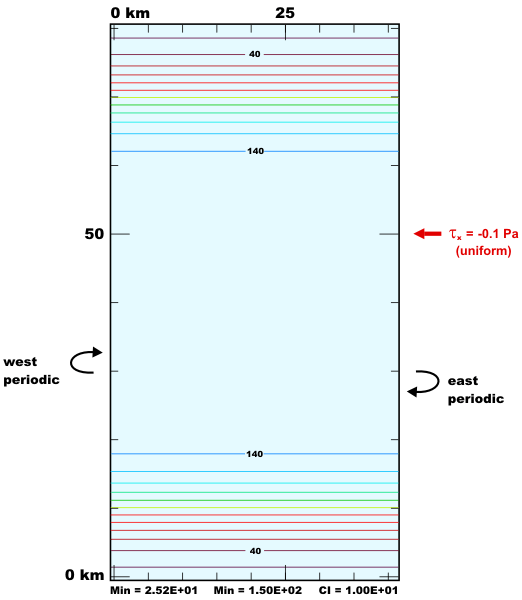
| 16:24, 21 July 2008 | upwelling domain.png (file) |  |
11 KB | Robertson | 4 | |
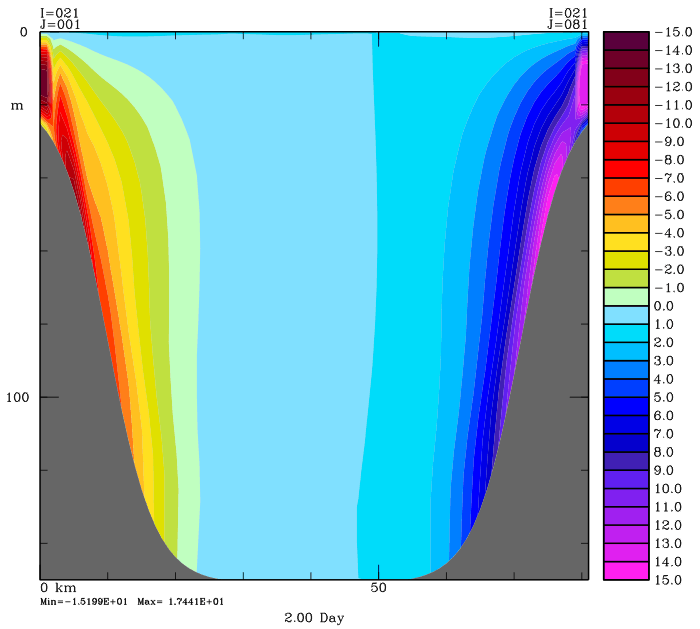
| 16:09, 18 July 2008 | wvel his 2.png (file) |  |
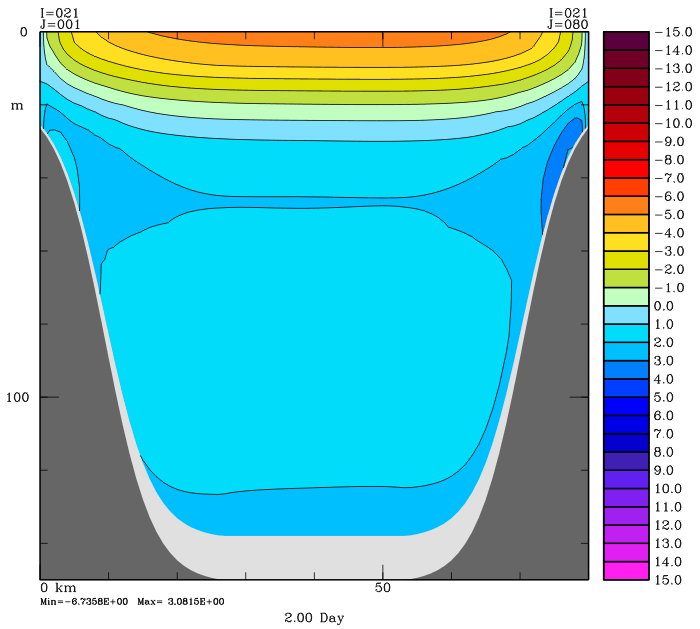
42 KB | Robertson | Day 2 w-velocity cross-section from an Upwelling history file. | 1 |
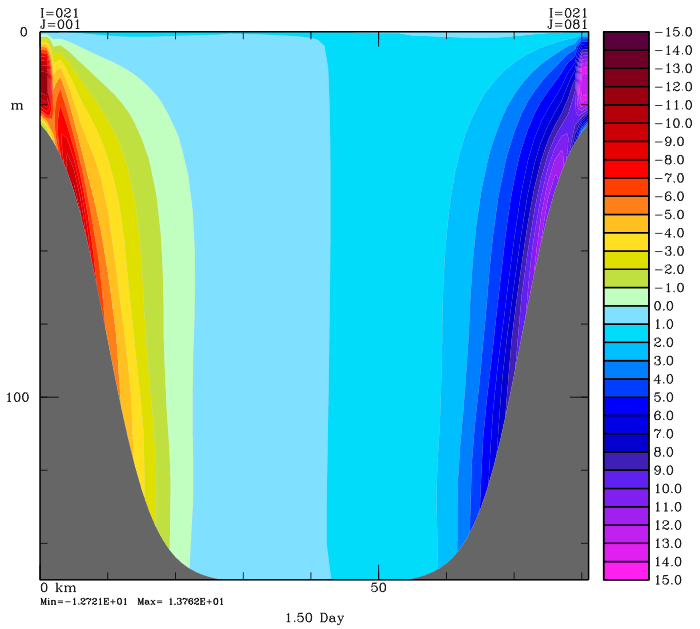
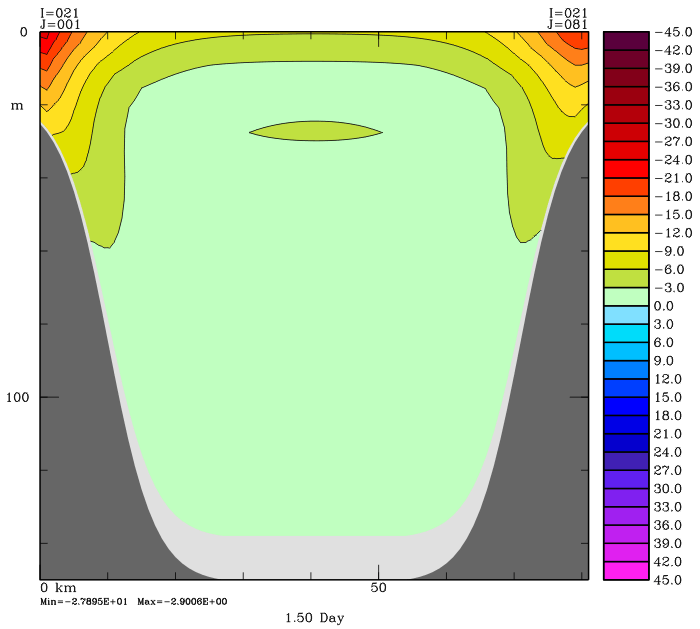
| 16:09, 18 July 2008 | wvel avg 1.5.png (file) |  |
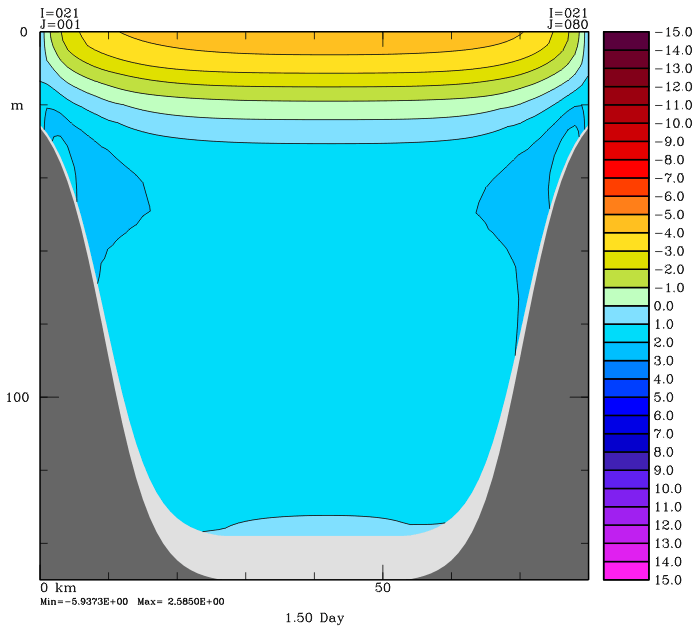
40 KB | Robertson | Day 1.5 w-velocity cross-section from an Upwelling averages file. | 1 |
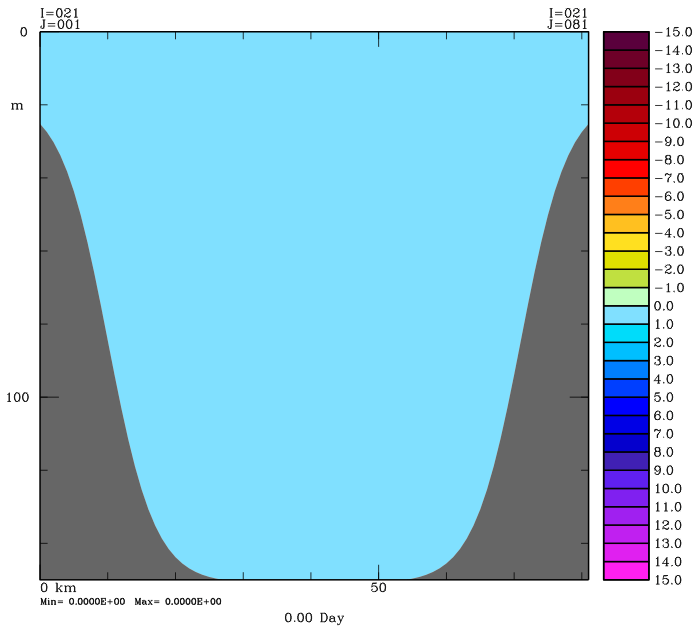
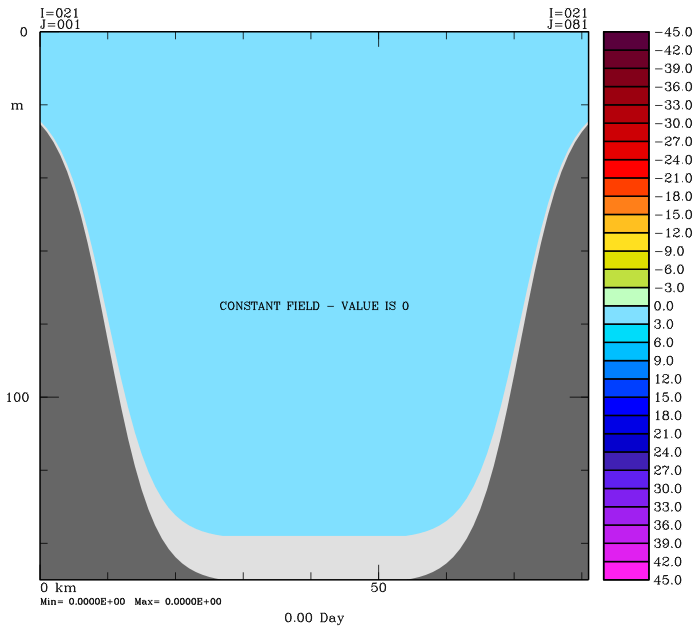
| 16:08, 18 July 2008 | wvel his 0.png (file) |  |
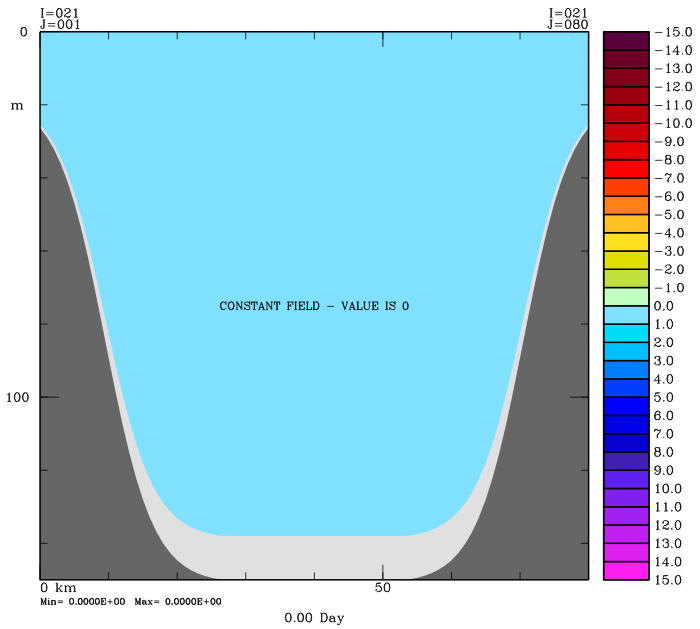
21 KB | Robertson | Day 0 w-velocity cross-section from an Upwelling history file. | 1 |
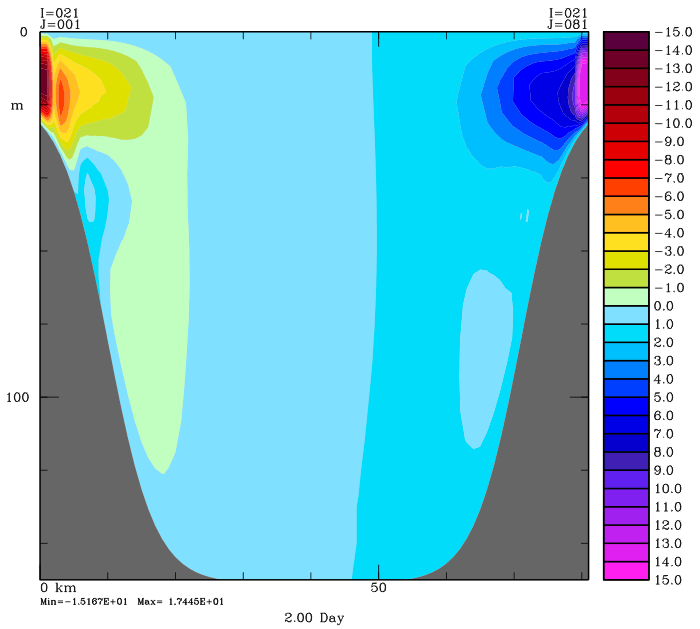
| 16:07, 18 July 2008 | vvel his 2.png (file) |  |
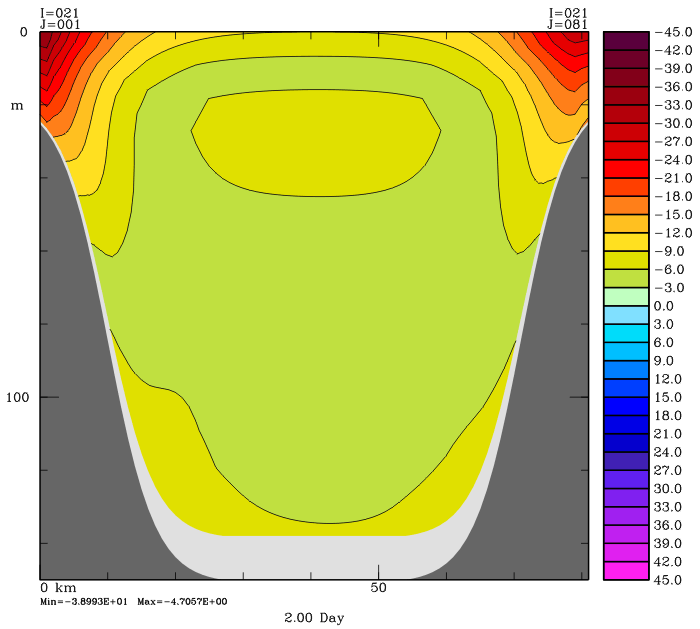
37 KB | Robertson | Day 2 v-velocity cross-section from an Upwelling history file. | 1 |
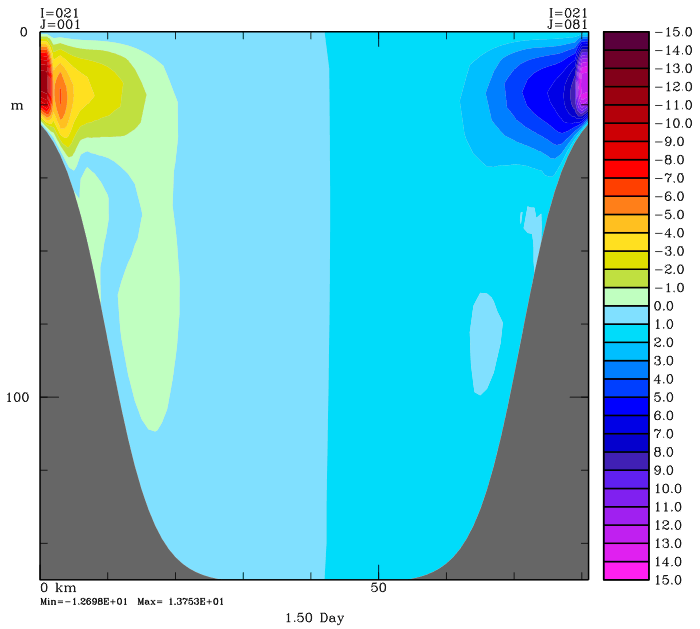
| 16:07, 18 July 2008 | vvel avg 1.5.png (file) |  |
34 KB | Robertson | Day 1.5 v-velocity cross-section from an Upwelling averages file. | 1 |
| 16:07, 18 July 2008 | vvel his 0.png (file) |  |
25 KB | Robertson | Day 0 v-velocity cross-section from an Upwelling history file. | 1 |
| 16:06, 18 July 2008 | uvel his 2.png (file) |  |
38 KB | Robertson | Day 2 u-velocity cross-section from an Upwelling history file. | 1 |
| 16:06, 18 July 2008 | uvel avg 1.5.png (file) |  |
32 KB | Robertson | Day 1.5 u-velocity cross-section from an Upwelling averages file. | 1 |
| 16:05, 18 July 2008 | uvel his 0.png (file) |  |
26 KB | Robertson | Day 0 u-velocity cross-section from an Upwelling history file. | 1 |
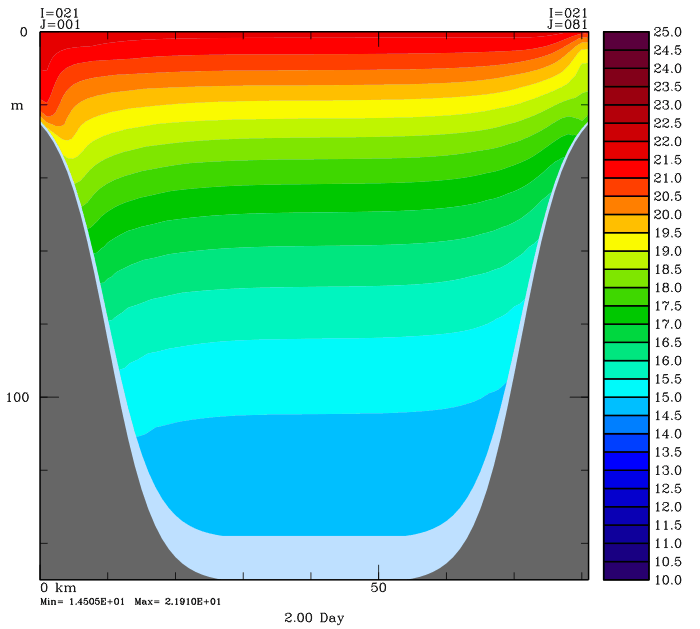
| 16:04, 18 July 2008 | t his 2.png (file) |  |
33 KB | Robertson | Day 2 temperature cross-section from an Upwelling history file. | 1 |
| 16:04, 18 July 2008 | omega avg 1.5.png (file) |  |
33 KB | Robertson | Day 1.5 omega cross-section from an Upwelling averages file. | 1 |
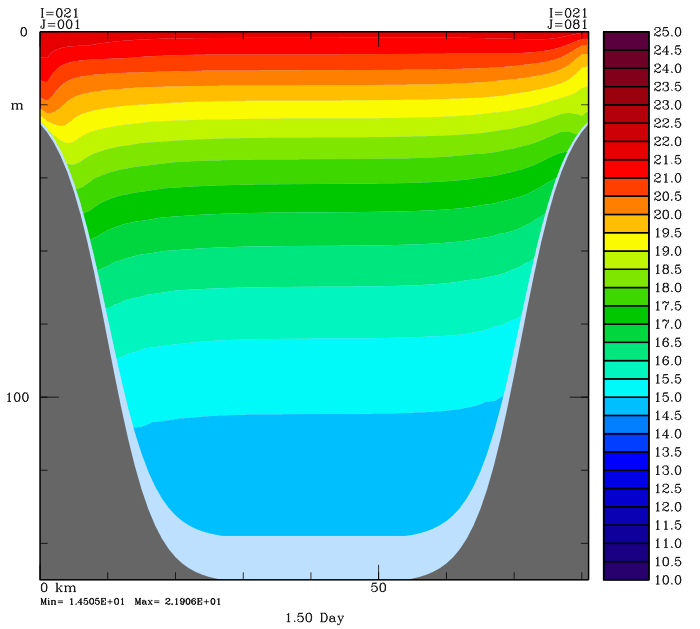
| 16:03, 18 July 2008 | t avg 1.5.png (file) |  |
31 KB | Robertson | Day 1.5 temperature cross-section from an Upwelling averages file. | 1 |
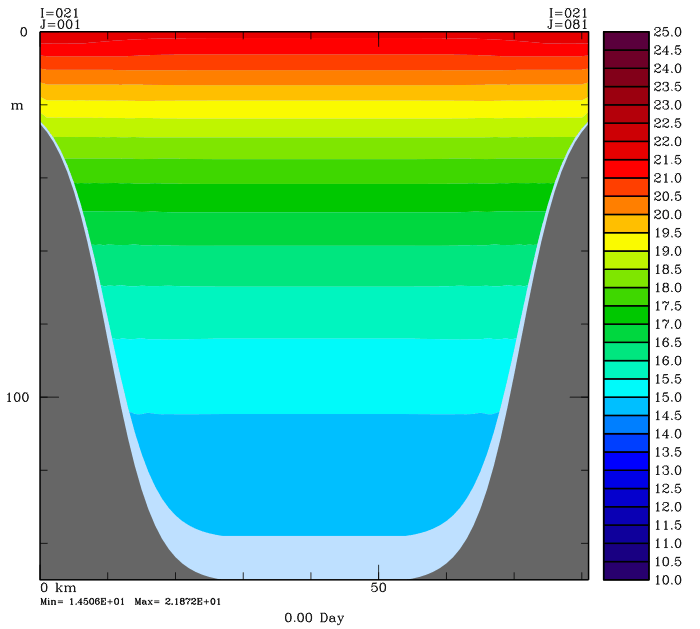
| 16:02, 18 July 2008 | t his 0.png (file) |  |
26 KB | Robertson | Day 0 temperature cross-section from an Upwelling history file. | 1 |
| 16:01, 18 July 2008 | omega his 2.png (file) |  |
35 KB | Robertson | Day 2 from an Upwelling history file. | 1 |