Uploads by Robertson
From WikiROMS
Jump to navigationJump to search
This special page shows all uploaded files.
| Date | Name | Thumbnail | Size | Description | Versions |
|---|---|---|---|---|---|
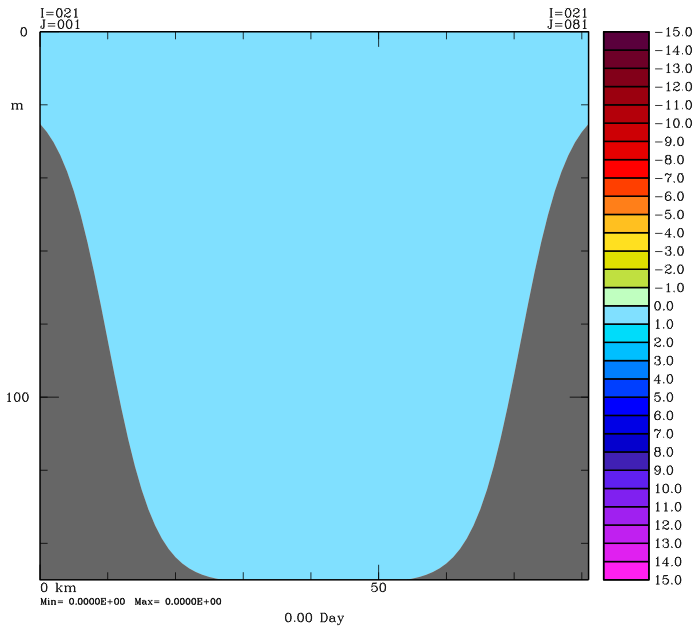
| 16:08, 18 July 2008 | wvel his 0.png (file) |  |
21 KB | Day 0 w-velocity cross-section from an Upwelling history file. | 1 |
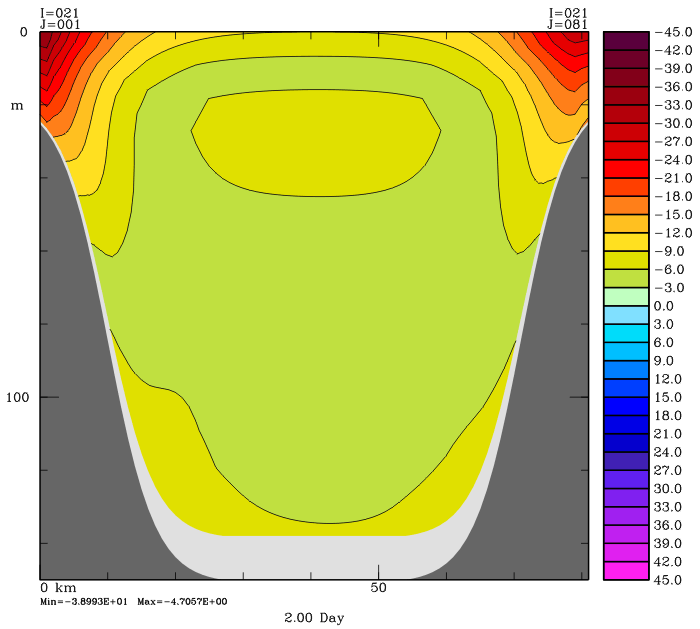
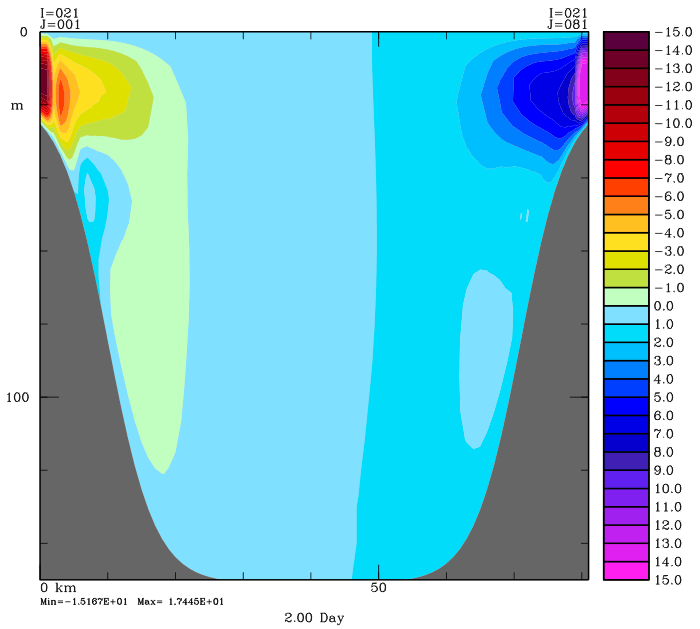
| 16:07, 18 July 2008 | vvel his 2.png (file) |  |
37 KB | Day 2 v-velocity cross-section from an Upwelling history file. | 1 |
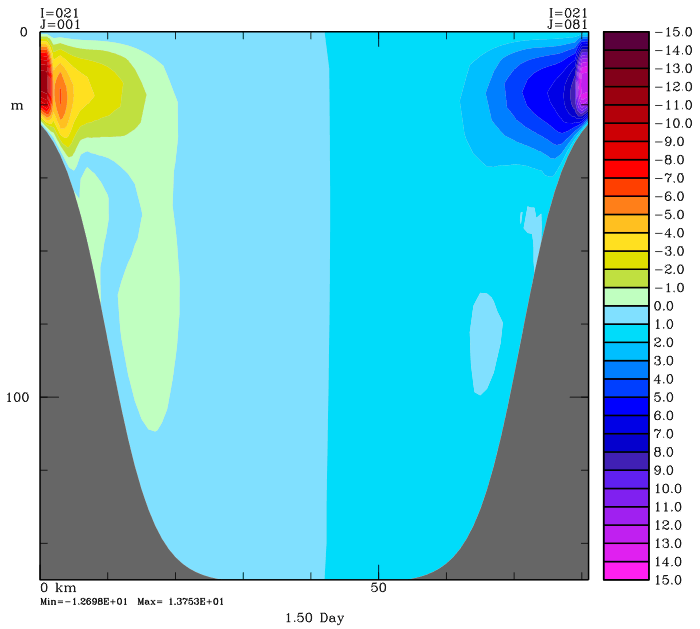
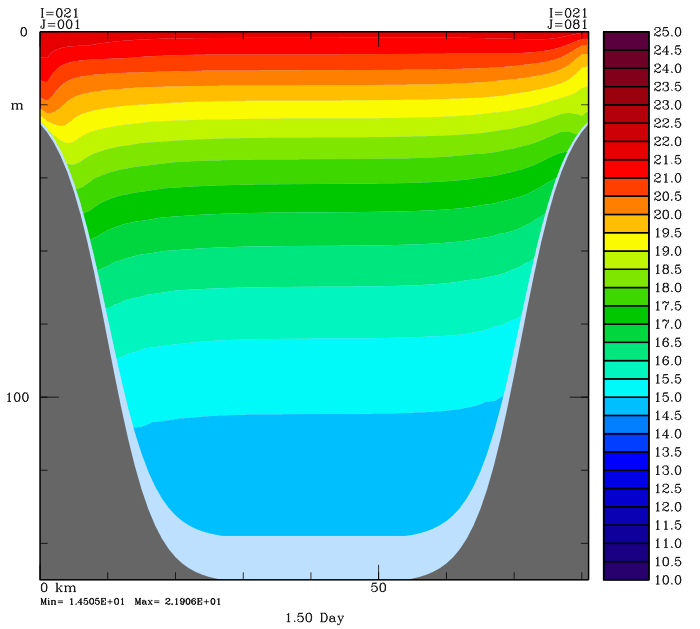
| 16:07, 18 July 2008 | vvel avg 1.5.png (file) |  |
34 KB | Day 1.5 v-velocity cross-section from an Upwelling averages file. | 1 |
| 16:07, 18 July 2008 | vvel his 0.png (file) |  |
25 KB | Day 0 v-velocity cross-section from an Upwelling history file. | 1 |
| 16:06, 18 July 2008 | uvel his 2.png (file) |  |
38 KB | Day 2 u-velocity cross-section from an Upwelling history file. | 1 |
| 16:06, 18 July 2008 | uvel avg 1.5.png (file) |  |
32 KB | Day 1.5 u-velocity cross-section from an Upwelling averages file. | 1 |
| 16:05, 18 July 2008 | uvel his 0.png (file) |  |
26 KB | Day 0 u-velocity cross-section from an Upwelling history file. | 1 |
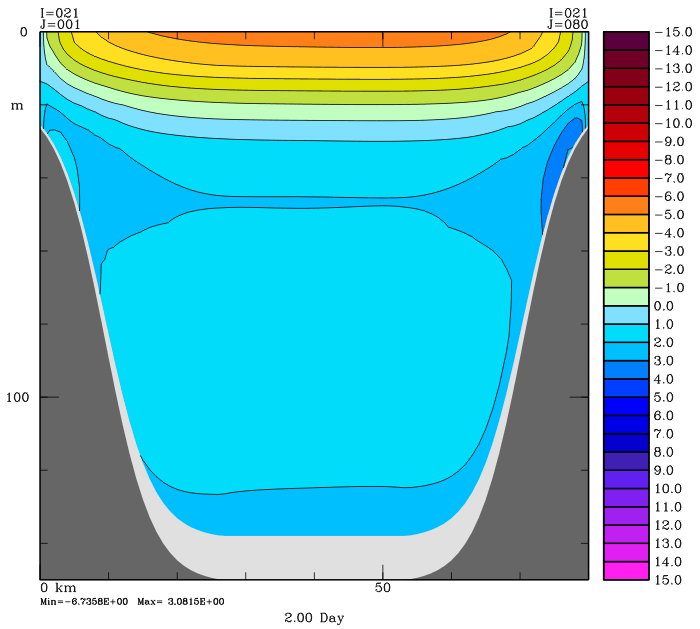
| 16:04, 18 July 2008 | t his 2.png (file) |  |
33 KB | Day 2 temperature cross-section from an Upwelling history file. | 1 |
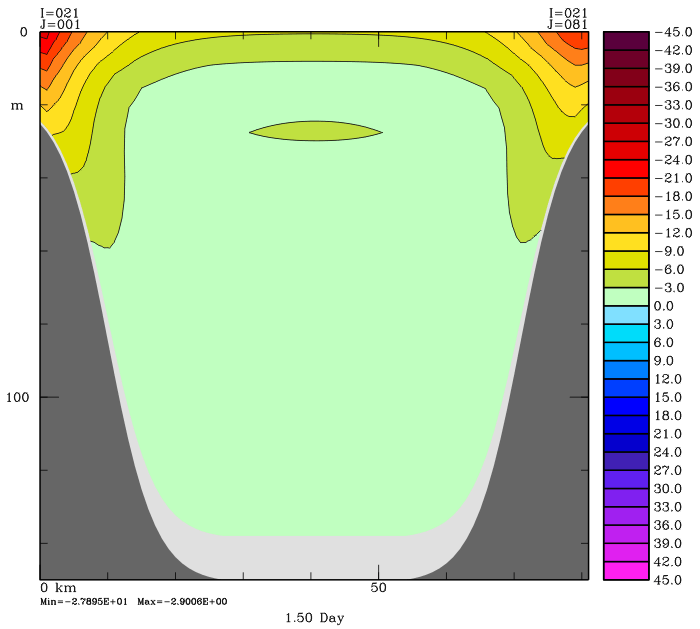
| 16:04, 18 July 2008 | omega avg 1.5.png (file) |  |
33 KB | Day 1.5 omega cross-section from an Upwelling averages file. | 1 |
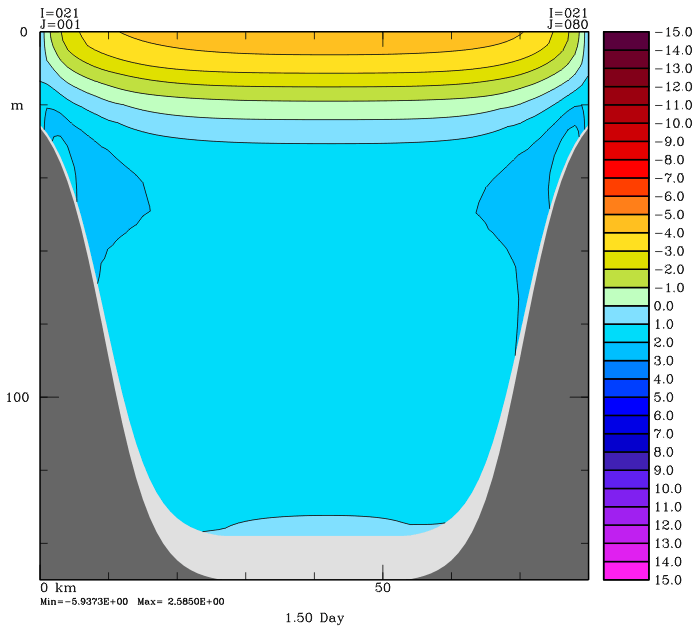
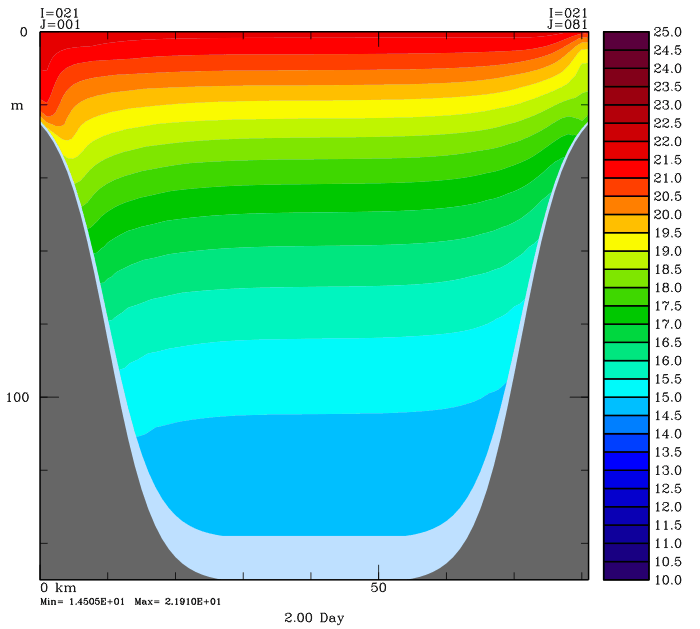
| 16:03, 18 July 2008 | t avg 1.5.png (file) |  |
31 KB | Day 1.5 temperature cross-section from an Upwelling averages file. | 1 |
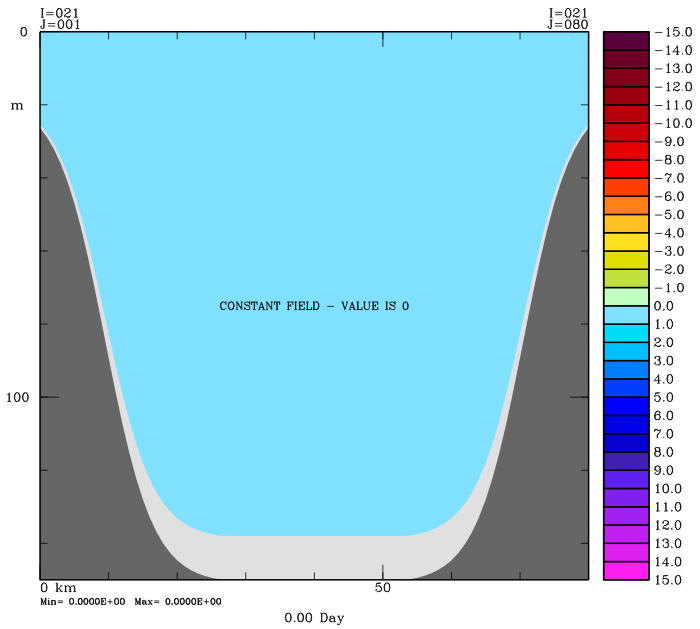
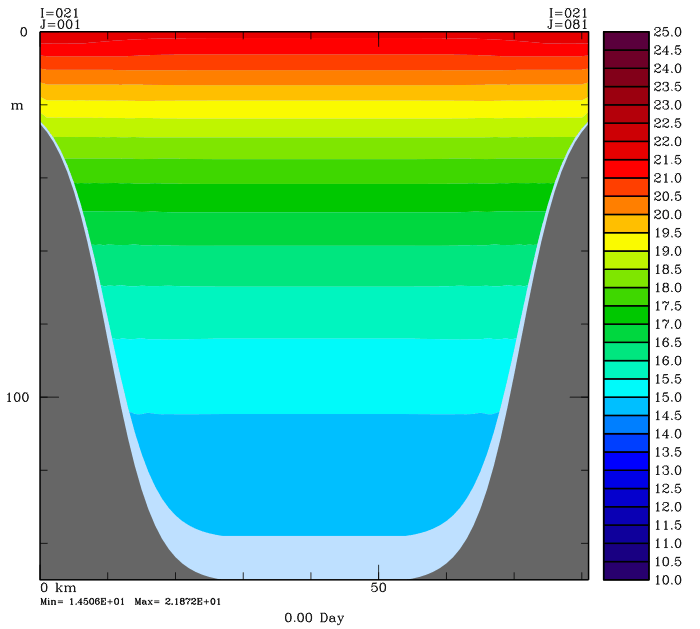
| 16:02, 18 July 2008 | t his 0.png (file) |  |
26 KB | Day 0 temperature cross-section from an Upwelling history file. | 1 |
| 16:01, 18 July 2008 | omega his 2.png (file) |  |
35 KB | Day 2 from an Upwelling history file. | 1 |
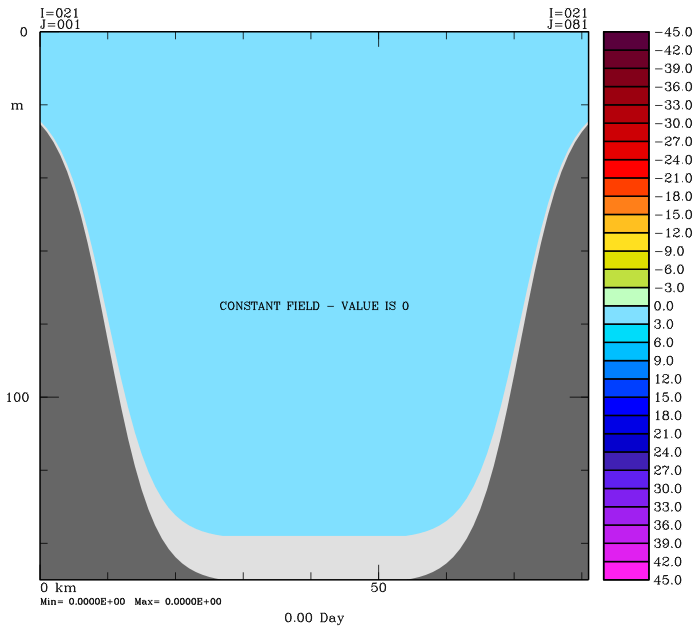
| 15:22, 18 July 2008 | omega his 0.png (file) |  |
21 KB | Day 0 from an Upwelling history file. | 1 |
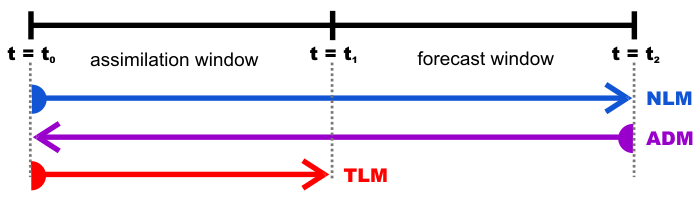
| 17:01, 10 July 2008 | obs sens time diagram.png (file) |  |
10 KB | 3 | |
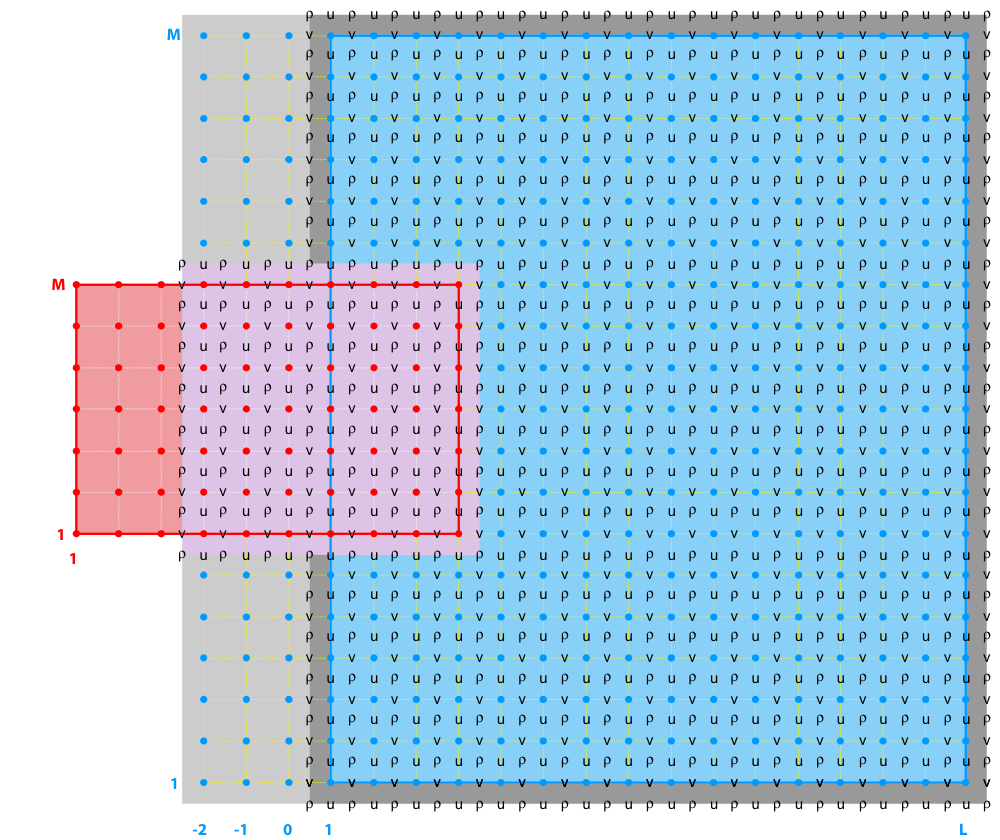
| 13:11, 1 April 2008 | composite grid1.png (file) |  |
78 KB | 1 | |
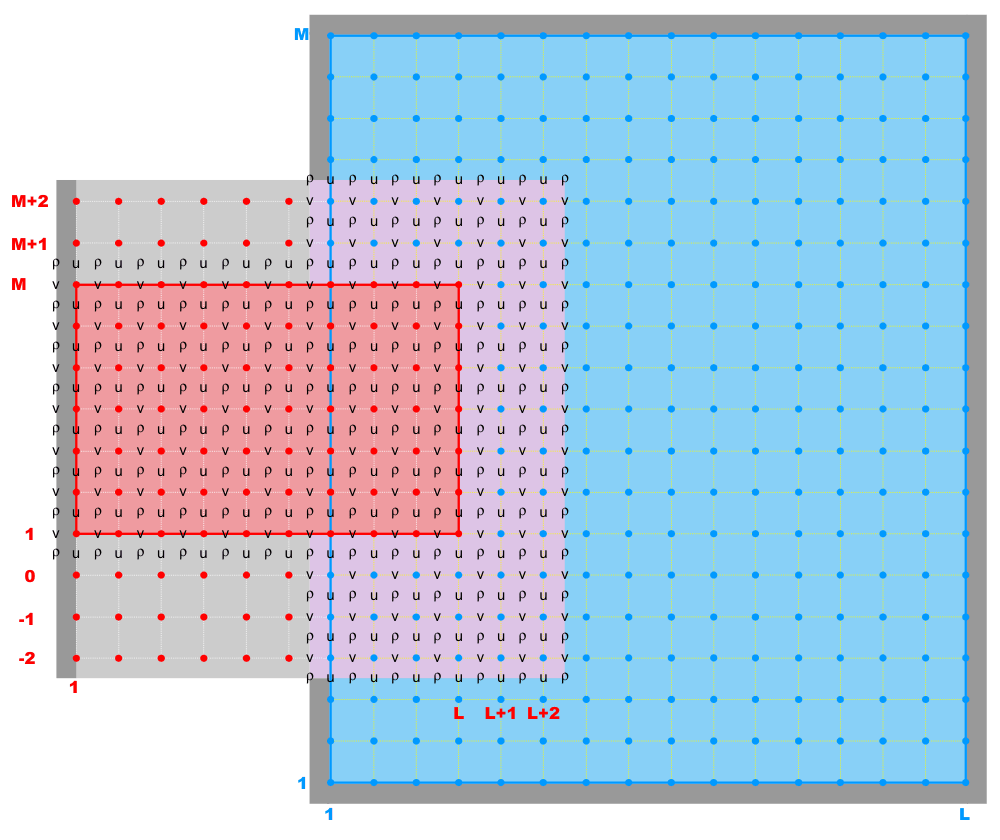
| 13:11, 1 April 2008 | composite grid2.png (file) |  |
103 KB | 1 | |
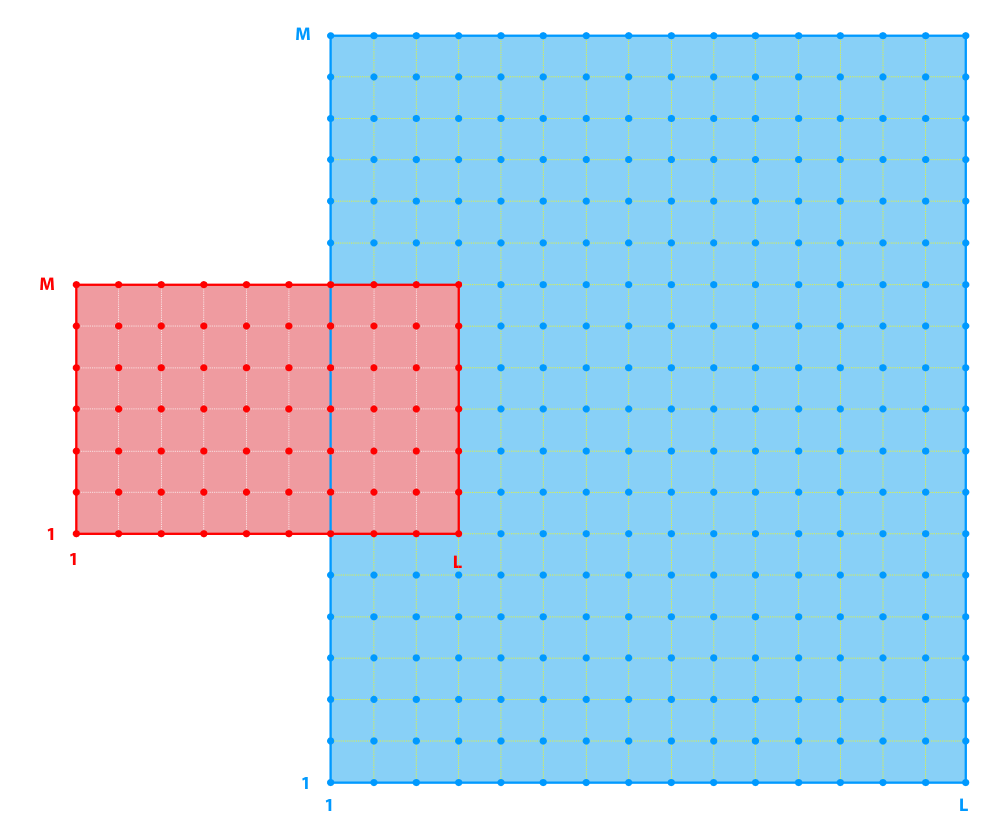
| 13:10, 1 April 2008 | composite.png (file) |  |
61 KB | 1 | |
| 13:07, 1 April 2008 | mosaic grid1.png (file) |  |
43 KB | 1 | |
| 13:07, 1 April 2008 | mosaic grid2.png (file) |  |
45 KB | 1 | |
| 13:05, 1 April 2008 | mosaic.png (file) |  |
37 KB | 1 | |
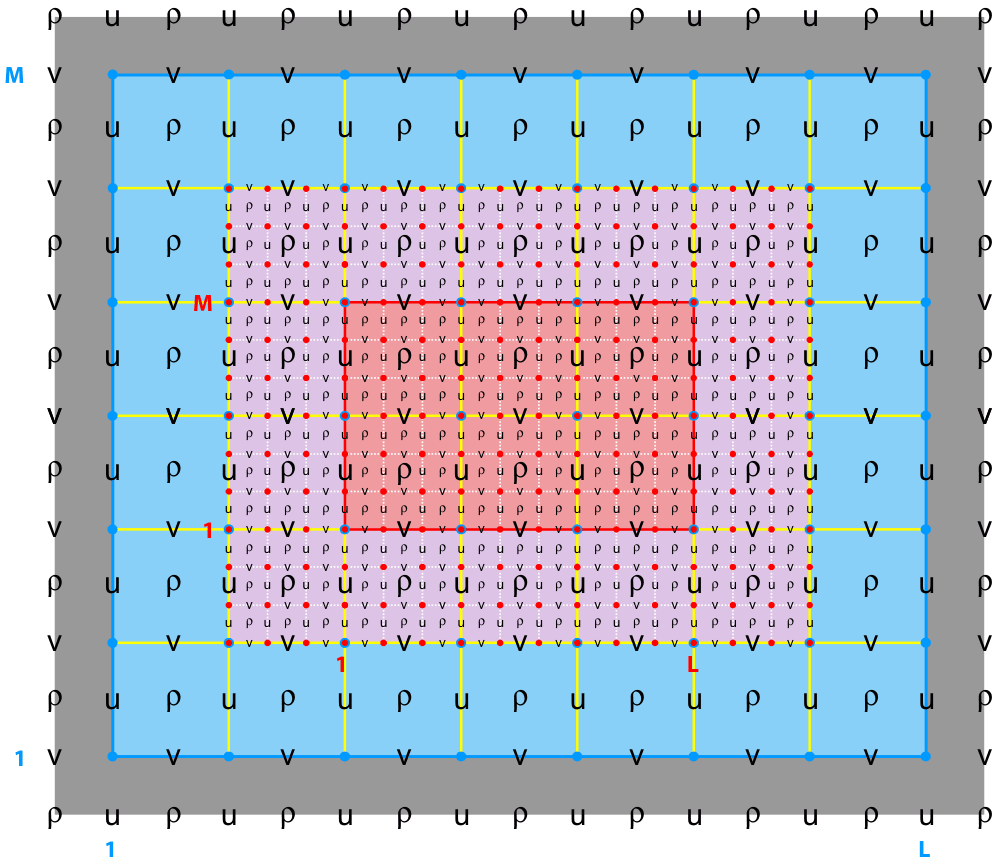
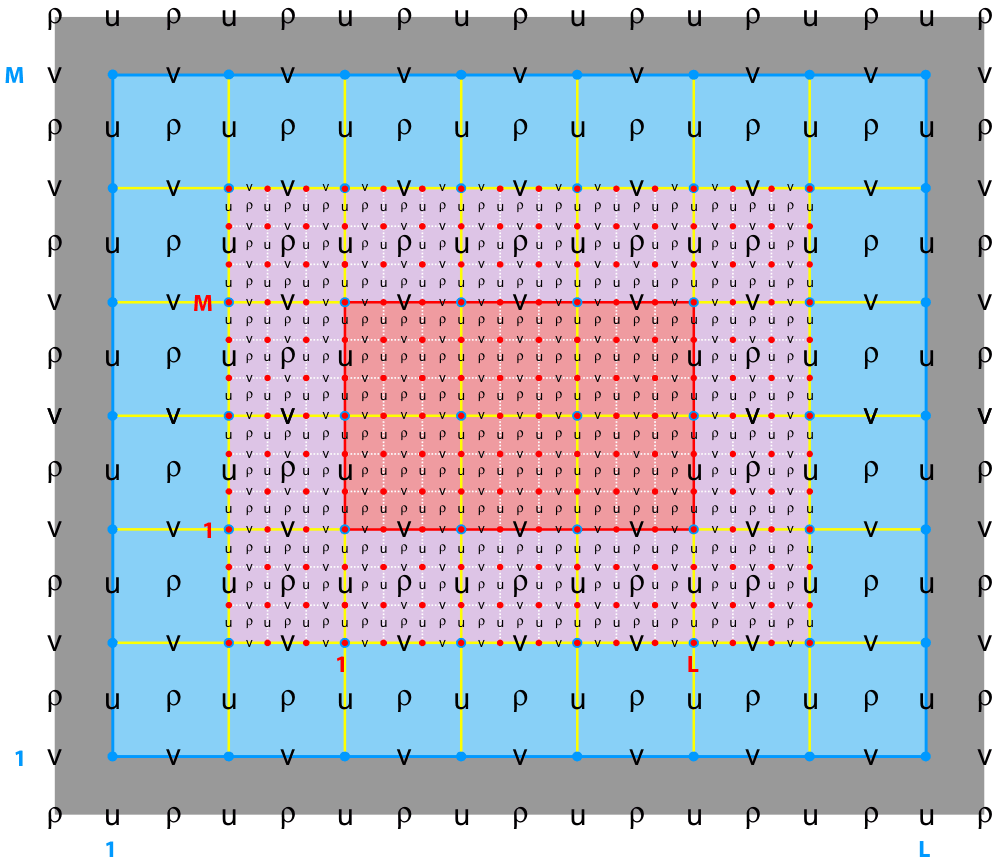
| 13:01, 1 April 2008 | refinement grid2.png (file) |  |
88 KB | 1 | |
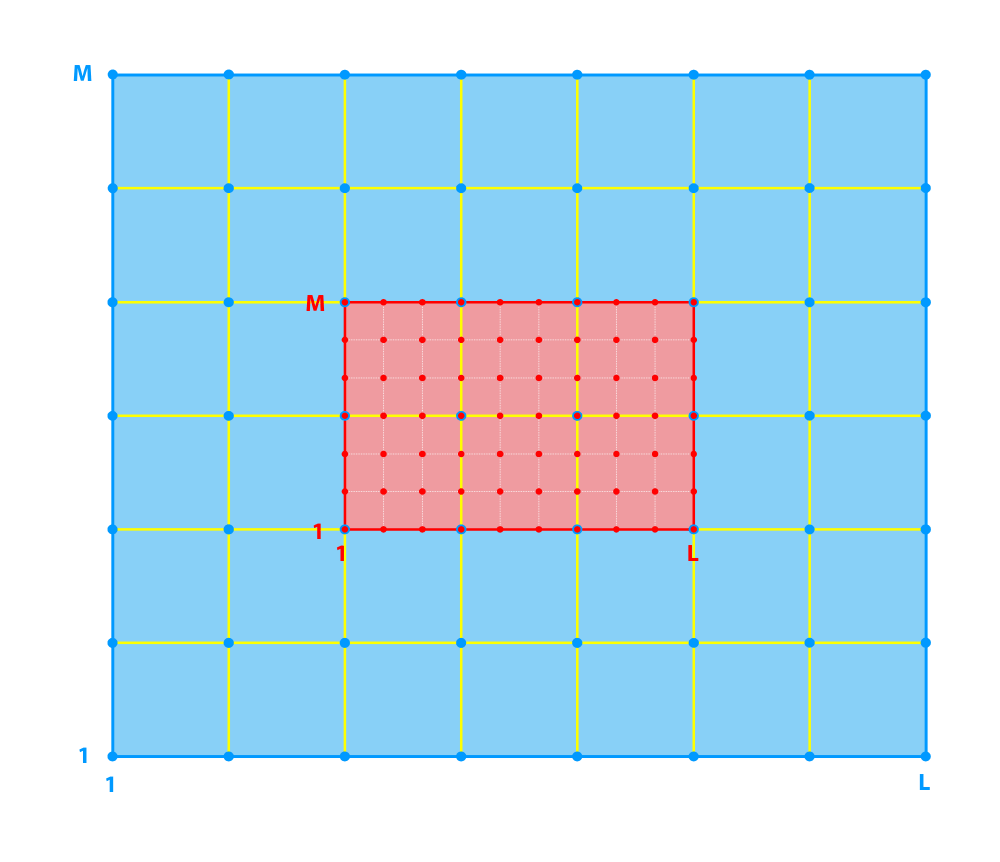
| 12:58, 1 April 2008 | refinement grid1.png (file) |  |
86 KB | 1 | |
| 12:56, 1 April 2008 | refinement.png (file) |  |
21 KB | 1 | |
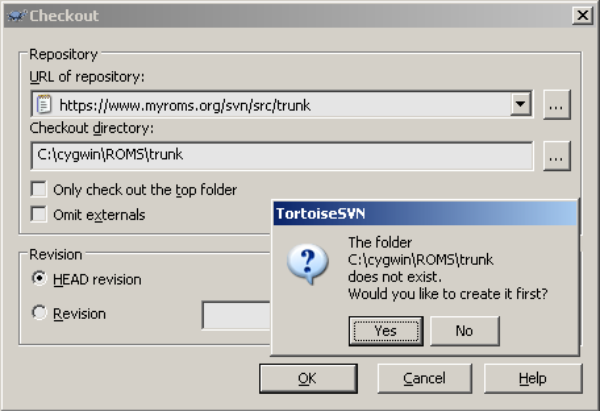
| 11:50, 28 March 2008 | tortoise co1.png (file) |  |
52 KB | 1 | |
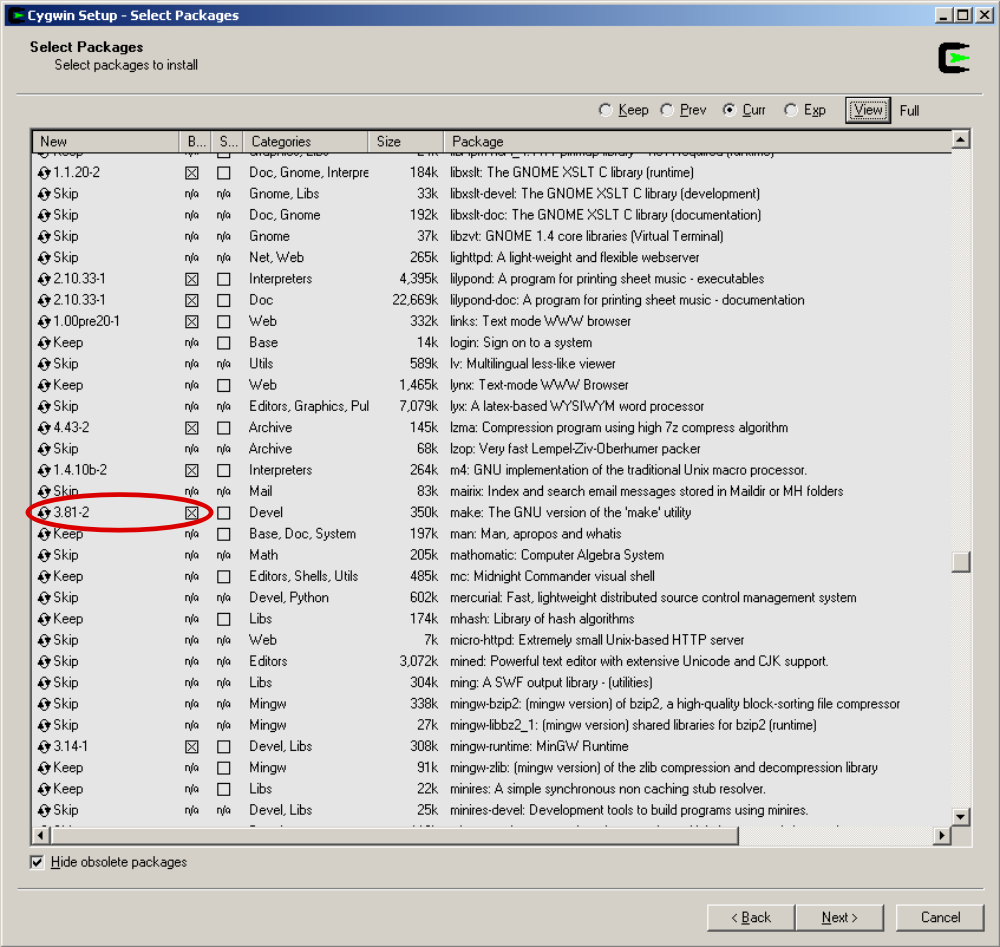
| 18:45, 27 March 2008 | cygwin make.png (file) |  |
260 KB | 1 | |
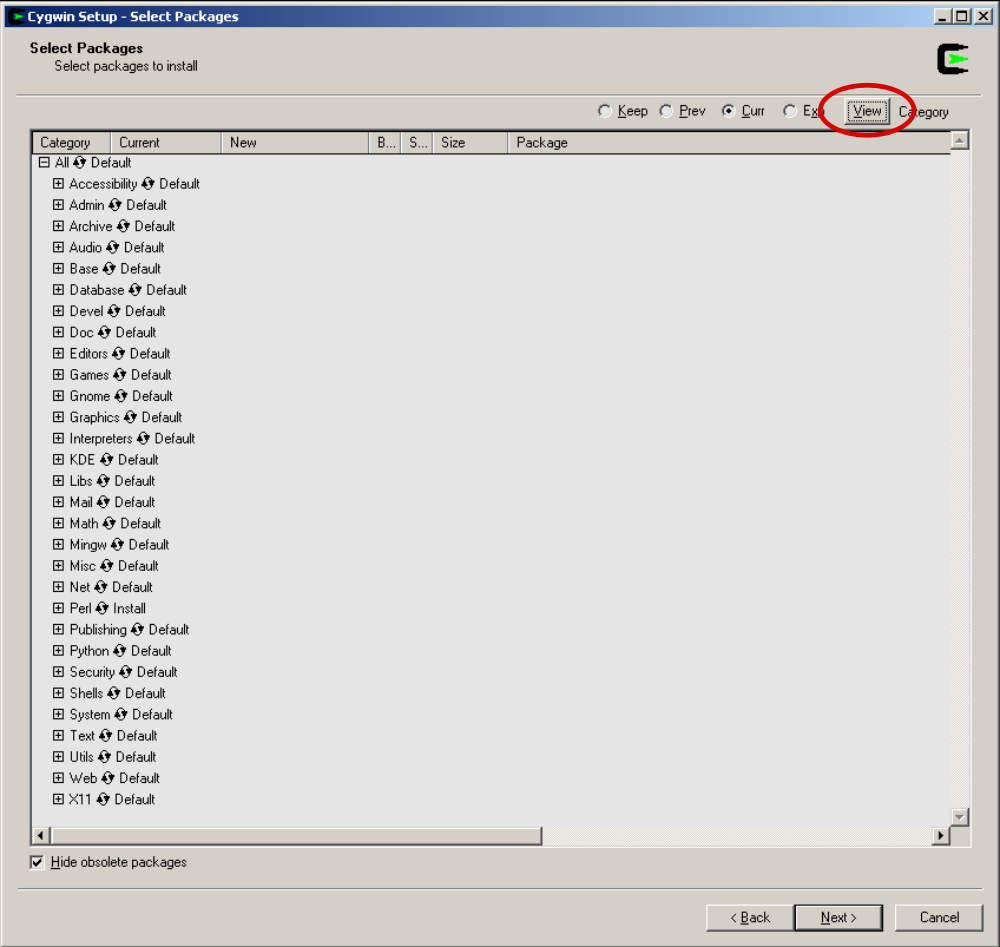
| 18:38, 27 March 2008 | cygwin view.png (file) |  |
137 KB | 1 | |
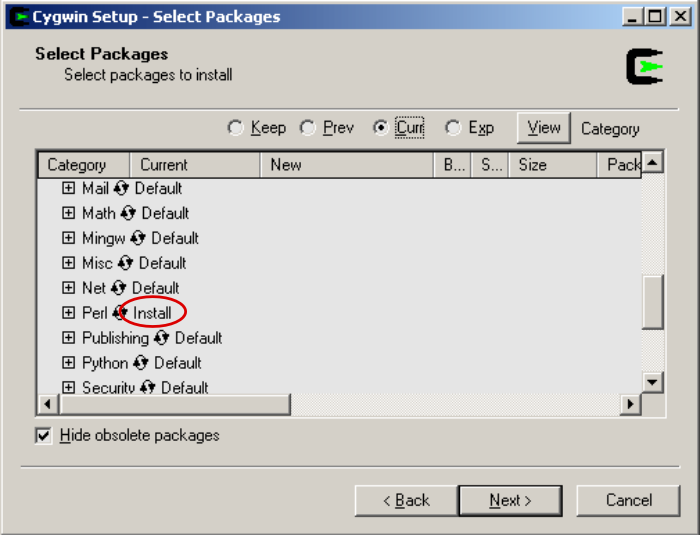
| 17:35, 27 March 2008 | cygwin perl.png (file) |  |
86 KB | 1 | |
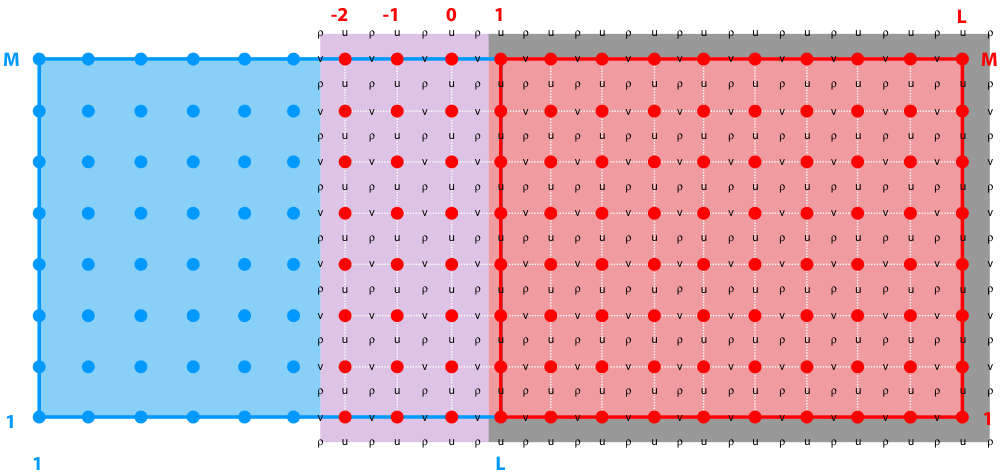
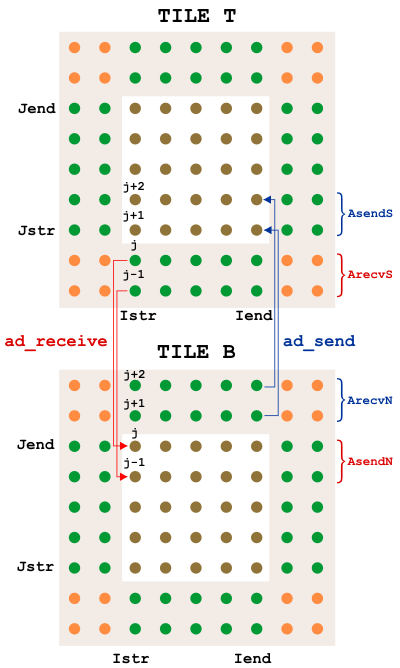
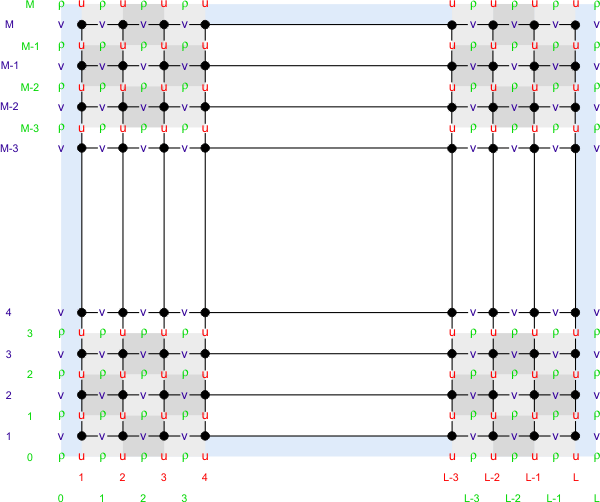
| 18:04, 20 March 2008 | adjoint communications NS.png (file) |  |
28 KB | North-South adjoint model communication diagram. | 1 |
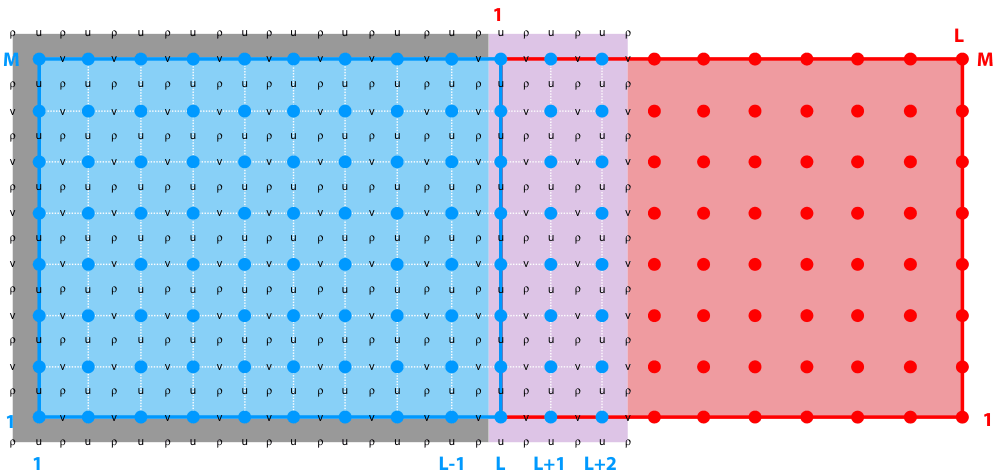
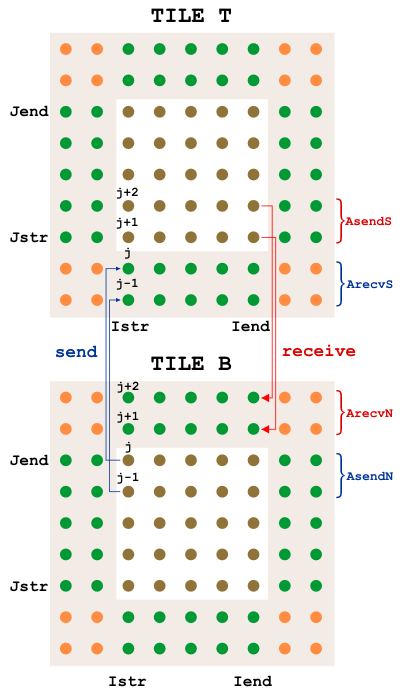
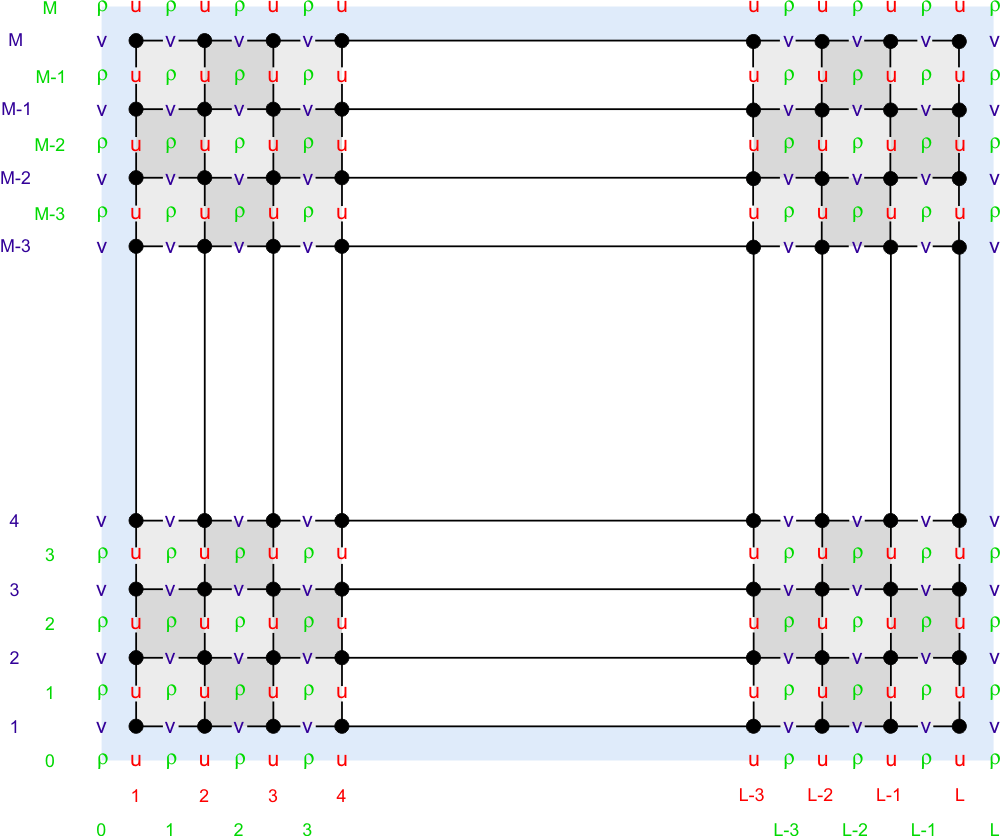
| 18:03, 20 March 2008 | communications NS.png (file) |  |
27 KB | North-South forward model communication diagram. | 1 |
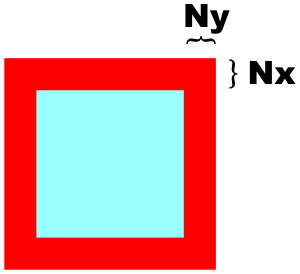
| 18:37, 19 March 2008 | tile.png (file) |  |
3 KB | Single tile schematic. | 1 |
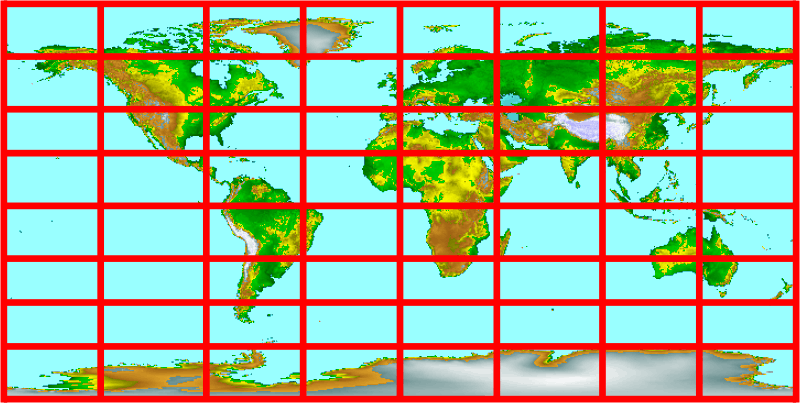
| 18:28, 19 March 2008 | parallel tile map.png (file) |  |
79 KB | Parallel Tiling Map | 1 |
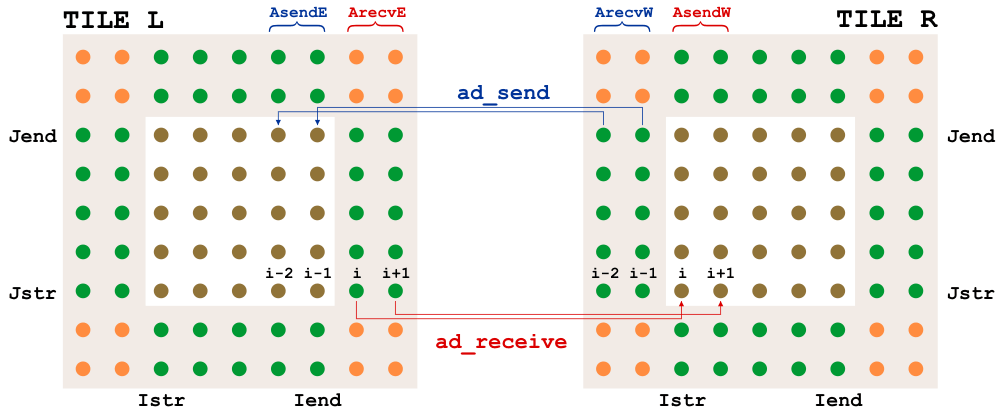
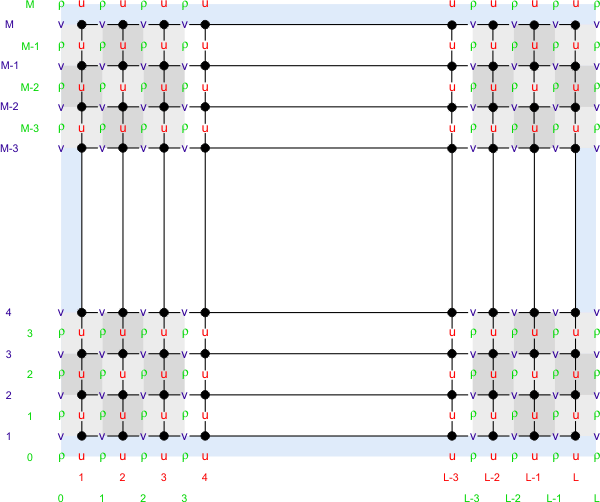
| 13:34, 13 March 2008 | adjoint communications.png (file) |  |
36 KB | This figure illustrates how the ROMS adjoint model communications work. | 1 |
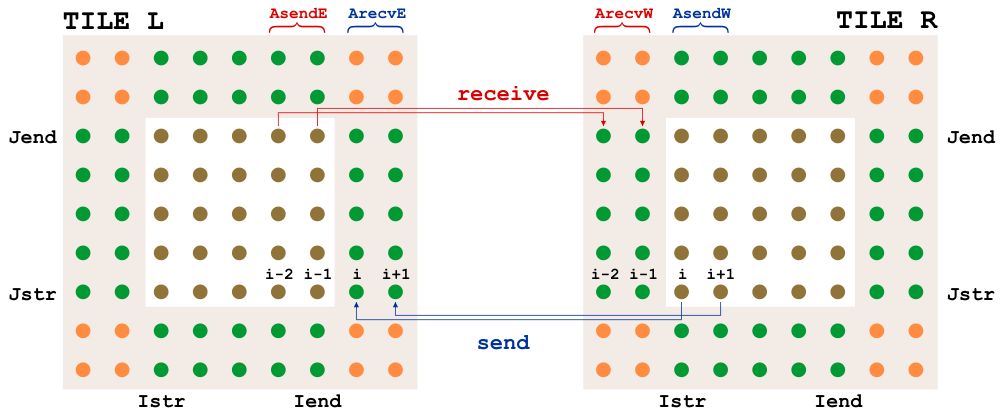
| 13:30, 13 March 2008 | communications.png (file) |  |
35 KB | This figure illustrates how ROMS forward model communications work. | 1 |
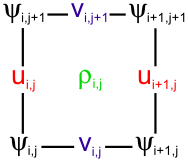
| 13:14, 13 March 2008 | grid cell.png (file) |  |
4 KB | Horizontal variable placement on ROMS grid. | 1 |
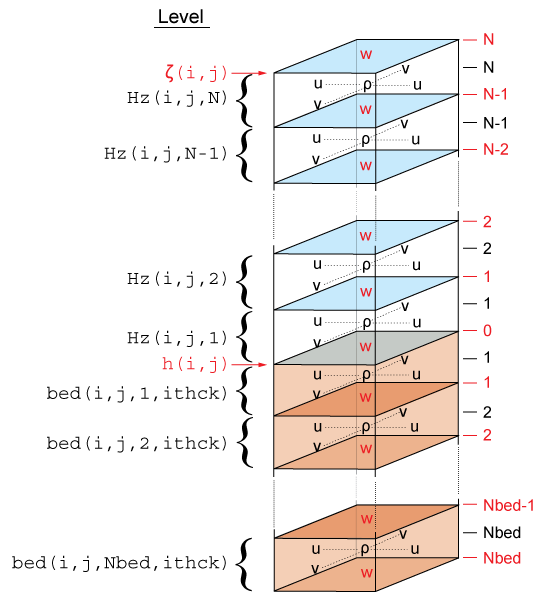
| 20:19, 7 March 2008 | vertical grid.png (file) |  |
18 KB | 1 | |
| 19:03, 3 March 2008 | upwelling velmag temp.gif (file) |  |
31 KB | Plot of temperature with velocity magnitude overlay. | 1 |
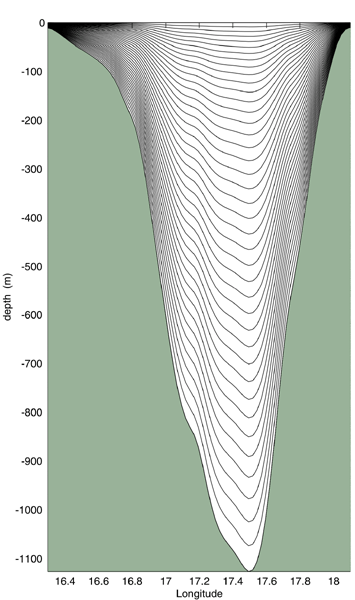
| 19:39, 29 February 2008 | vieste-dubrovnik.png (file) |  |
57 KB | This is a plot of the vertical cross-section from Vieste, Italy to Dubrovnik, Croatia with a stretched s-coordinate system overlay. | 1 |
| 19:36, 28 February 2008 | staggered grid rho cells.png (file) |  |
45 KB | 1 | |
| 18:14, 25 February 2008 | staggered grid v cells.png (file) |  |
25 KB | This image illustrates the ROMS staggered grid with respect to v points. | 1 |
| 18:11, 25 February 2008 | staggered grid u cells.png (file) |  |
24 KB | This image illustrates the ROMS staggered grid with respect to rho points. | 1 |
| 20:08, 15 January 2008 | philip hraw.gif (file) |  |
49 KB | Screenshot of Philex bathymetry plot in IDT using gebco1.pal. | 1 |
| 23:17, 14 January 2008 | idt play.gif (file) |  |
364 bytes | gif of play button from IDT. | 1 |
| 20:47, 19 June 2007 | Warning.png (file) |  |
3 KB | warning icon | 1 |
| 18:16, 19 June 2007 | Nuvola apps important.png (file) |  |
54 KB | error icon | 1 |
| 16:24, 19 June 2007 | Bulbgraph.png (file) |  |
5 KB | note image | 1 |
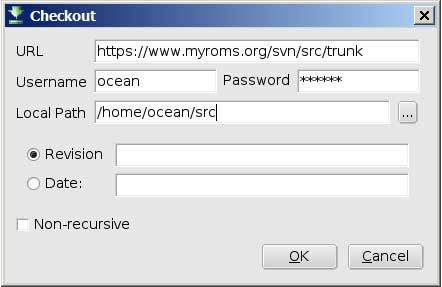
| 17:37, 26 April 2007 | esvn checkout.jpg (file) |  |
15 KB | 1 | |
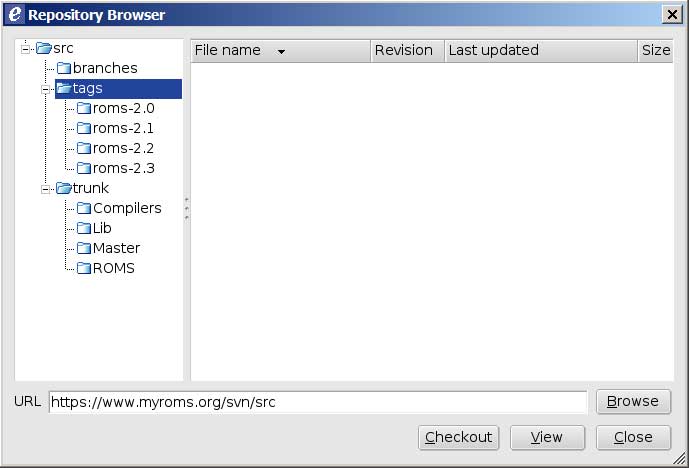
| 17:35, 26 April 2007 | esvn browser.jpg (file) |  |
25 KB | 1 | |
| 09:28, 8 November 2006 | IMG 3887.jpg (file) |  |
1.58 MB | ROMS Mascot | 1 |
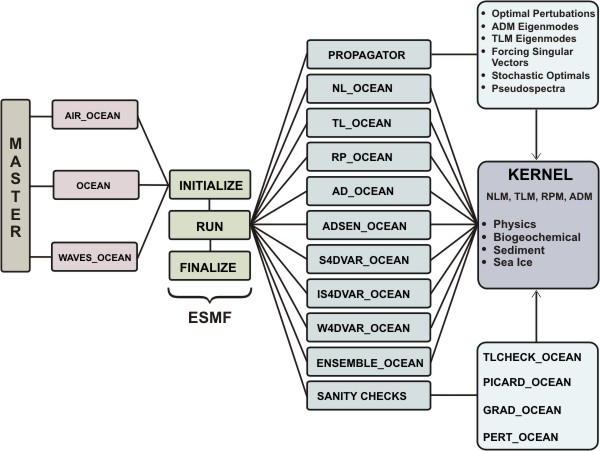
| 19:27, 27 October 2006 | Framework.png (file) |  |
81 KB | 1 | |
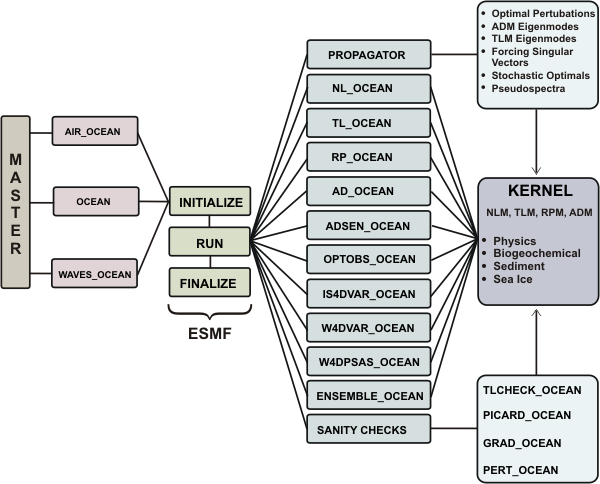
| 17:31, 27 October 2006 | Framework.jpg (file) |  |
63 KB | Schematic diagram of the ROMS Framework | 1 |