File:cost fig3.png
Original file (951 × 767 pixels, file size: 15 KB, MIME type: image/png)
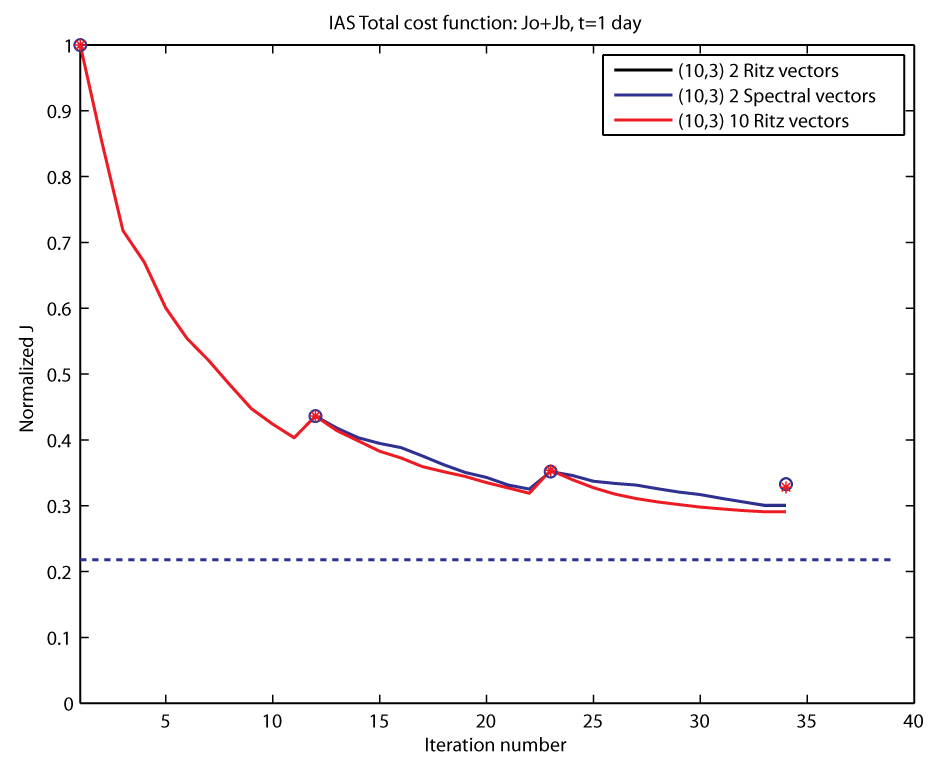
The normalized cost function J computed within inner-loops (curves) and JNL the cost function computed relative to the nonlinear model during outer-loops (open circles). The various cases shown are for a 1-day assimilation window: (10,3) and Ritz preconditioning using 2 Ritz vectors (black curve, black circles), and 10 Ritz vectors (red curve, red asterisks); and (10,3) and spectral preconditioning using 2 eigenvectors (blue line, blue circles).The horizontal dashed blue line represents the theoretical minimum value of the cost function given by half the number of assimilated observations.
File history
Click on a date/time to view the file as it appeared at that time.
| Date/Time | Thumbnail | Dimensions | User | Comment | |
|---|---|---|---|---|---|
| current | 18:28, 4 November 2008 | | 951 × 767 (15 KB) | Robertson (talk | contribs) | The normalized cost function J computed within inner-loops (curves) and JNL the cost function computed relative to the nonlinear model during outer-loops (open circles). The various cases shown are for a 1-day assimilation window: (10,3) and Ritz precondi |
You cannot overwrite this file.
File usage
The following page uses this file: