Difference between revisions of "Model Coupling SANDY"
| Line 1: | Line 1: | ||
<div class="title"> | <div class="title">Hurricane Sandy (SANDY)</div>__NOTOC__ | ||
<!-- Edit Template:Model_Coupling_TOC to modify this Table of Contents--> | <!-- Edit Template:Model_Coupling_TOC to modify this Table of Contents--> | ||
Revision as of 14:26, 11 September 2019
DATA-WRF-ROMS Coupled Application
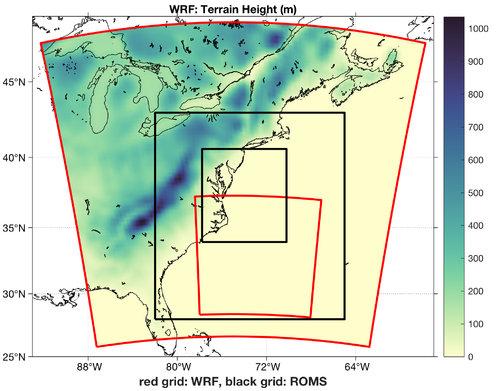
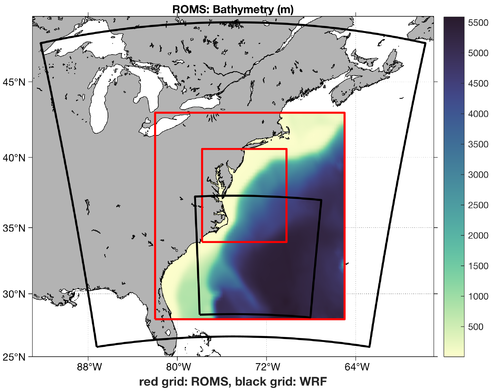
- SANDY COAWST application 87x65x65 with dx~18 km and dy~24 km (coarser), and 116x86x16 with dx~6 km and dy~8 km (finer)
- WRF COAWST application 85x82x48 with dx=dy=30 km (coarser), and 100x100x48 with dx=dy=15 km (finer)
- Time stepping: WRF 180 and 60 s, ROMS 30 and 15 s
- Coupling Simulation E03: Using ROMS bulk fluxes parameterization
- Sequential and semi-implicit coupling, No Nesting, ESMF/NUOPC library
- Non nested WRF, just coarser grid
- Coupling interval: 180 s (every 6 ROMS timesteps), WRF exports instantaneous fields
- WRF imports SST from DATA and ROMS components
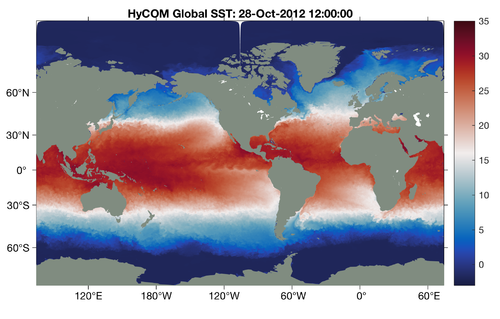
- DATA component reads SST from HyCOM 1/12 dataset, 4500x3298
- ROMS activates BULK_FLUXES, EMINUSP, and LONGWAVE_OUT
- ROMS imports dLWrad, SWrad, Pair, Tair, Qair, rain, Uwind, and Vwind
- Coupling Simulation E02: Using WRF surface fluxes parameterization
- Sequential and semi-implicit coupling, No Nesting, ESMF/NUOPC library
- Non nested WRF, just coarser grid
- Coupling interval: 180 s (every 6 ROMS timesteps), WRF exports instantaneous fields
- WRF imports SST from DATA and ROMS components
- DATA component reads SST from HyCOM 1/12 dataset, 4500x3298
- ROMS deactivates BULK_FLUXES, EMINUSP, and LONGWAVE_OUT
- ROMS imports SWrad, Pair, shflux, swflux, sustr, and svstr
- Coupling Simulation M01: Using WRF surface fluxes parameterization
- Concurrent nested coupling, COAWST MCT library
- Coupling interval: 180 s, WRF exports instantaneous fields
- ROMS activates ATM2OCN_FLUXES and EMINUSP
 | |
|
Figure 1: WRF terrain height (left) and ROMS bathymetry (right)
| Hurricane Sandy Storm Track |
|---|
|
| Source: NOAA's National Weather Service |
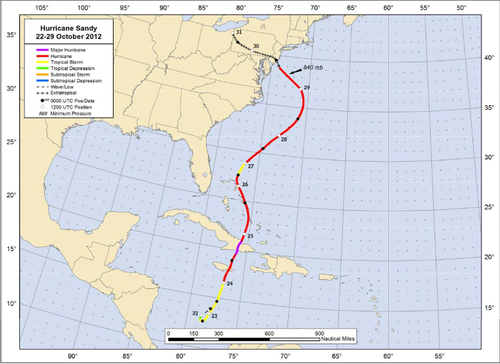
Figure 2: Hurricane Sandy storm track
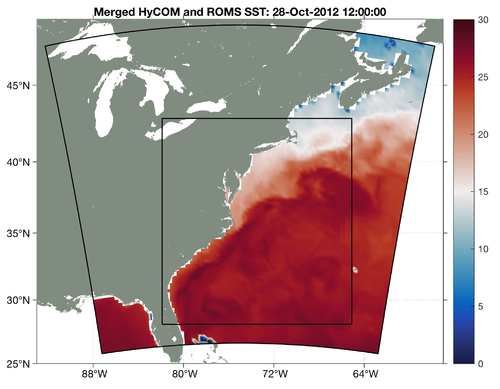
 | |
|
Figure 3: WRF sea-surface temperature inputs from HyCOM (left) and merged HyCOM-ROMS (right) for October 28, 2012.
| DATA-WRF-ROMS No Nesting |
DATA-WRF-ROMS No Nesting |
WRF-ROMS Nested |
| ESMF Coupling: 180s BULK_FLUXES |
ESMF Coupling: 180s ATM_SBL |
ESMF Coupling: 180s ATM SBL |
Animation 1: Surface Shortwave Radiation Comparison (W/m2)
| DATA-WRF-ROMS No Nesting |
DATA-WRF-ROMS No Nesting |
WRF-ROMS Nested |
| ESMF Coupling: 180s BULK_FLUXES |
ESMF Coupling: 180s ATM_SBL |
ESMF Coupling: 180s ATM SBL |
Animation 2: Surface Net Heat Flux Comparison (W/m2)
| DATA-WRF-ROMS No Nesting |
DATA-WRF-ROMS No Nesting |
WRF-ROMS Nested |
| ESMF Coupling: 180s BULK_FLUXES |
ESMF Coupling: 180s ATM_SBL |
ESMF Coupling: 180s ATM SBL |
Animation 3: Surface Temperature Comparison (°C)
| DATA-WRF-ROMS No Nesting |
DATA-WRF-ROMS No Nesting |
WRF-ROMS Nested |
| ESMF Coupling: 180s BULK_FLUXES |
ESMF Coupling: 180s ATM_SBL |
ESMF Coupling: 180s ATM SBL |
Animation 4: Surface Freshwater Flux Comparison (m/day): (E-P)*SSS
| DATA-WRF-ROMS No Nesting |
DATA-WRF-ROMS No Nesting |
WRF-ROMS Nested |
| ESMF Coupling: 180s BULK_FLUXES |
ESMF Coupling: 180s ATM_SBL |
ESMF Coupling: 180s ATM SBL |
Animation 5: Surface Salinity Comparison
| DATA-WRF-ROMS No Nesting |
DATA-WRF-ROMS No Nesting |
WRF-ROMS Nested |
| ESMF Coupling: 180s BULK_FLUXES |
ESMF Coupling: 180s ATM_SBL |
ESMF Coupling: 180s ATM SBL |
Animation 6: Free-Surface Comparison (m)
| DATA-WRF-ROMS No Nesting |
DATA-WRF-ROMS No Nesting |
WRF-ROMS Nested |
| ESMF Coupling: 180s BULK_FLUXES |
ESMF Coupling: 180s ATM_SBL |
ESMF Coupling: 180s ATM SBL |
Animation 7: Surface Current Comparison (m/s)
| DATA-WRF-ROMS No Nesting |
DATA-WRF-ROMS No Nesting |
WRF-ROMS Nested |
| ESMF Coupling: 180s BULK_FLUXES |
ESMF Coupling: 180s ATM_SBL |
ESMF Coupling: 180s ATM SBL |
Animation 8: Surface Wind Stress Comparison (N/m2)
| NASA GEOS-5 Global Atmosphere Model: Oct 26-31, 2012 |
|---|
| Source: NASA Goddard |
Animation 9: NASA GEOS-5 Global Atmosphere Model, October 26-31, 2012 Source: NASA Goddard
| NASA GOES Satellites: Hurricane Sandy 23-31 October 2012 |
|---|
| Source: NASA & NOAA with MODIS True-Color Map |
Animation 10: NASA GOES Satellites: Hurricane Sandy October 23-31, 2012