noisy vertical velocity in deep bathymetry and uv with high value

Report or discuss software problems and other woes

Moderators: arango, robertson

Post Reply
Message
Author
Study_fish
Posts: 23
Joined: Thu Sep 21, 2023 2:52 pm
Location: Sun Yat-sen University

noisy vertical velocity in deep bathymetry and uv with high value

#1 Unread post by Study_fish »

Dear ROMS users:

I'm back. In my previous post:viewtopic.php?p=25370#p25370, the problem may not have been described clearly. I have made a lot of attempts during this period, and I would like to describe my running process in more detail. There may be other users who encounter the same problem, and we can discuss it together.

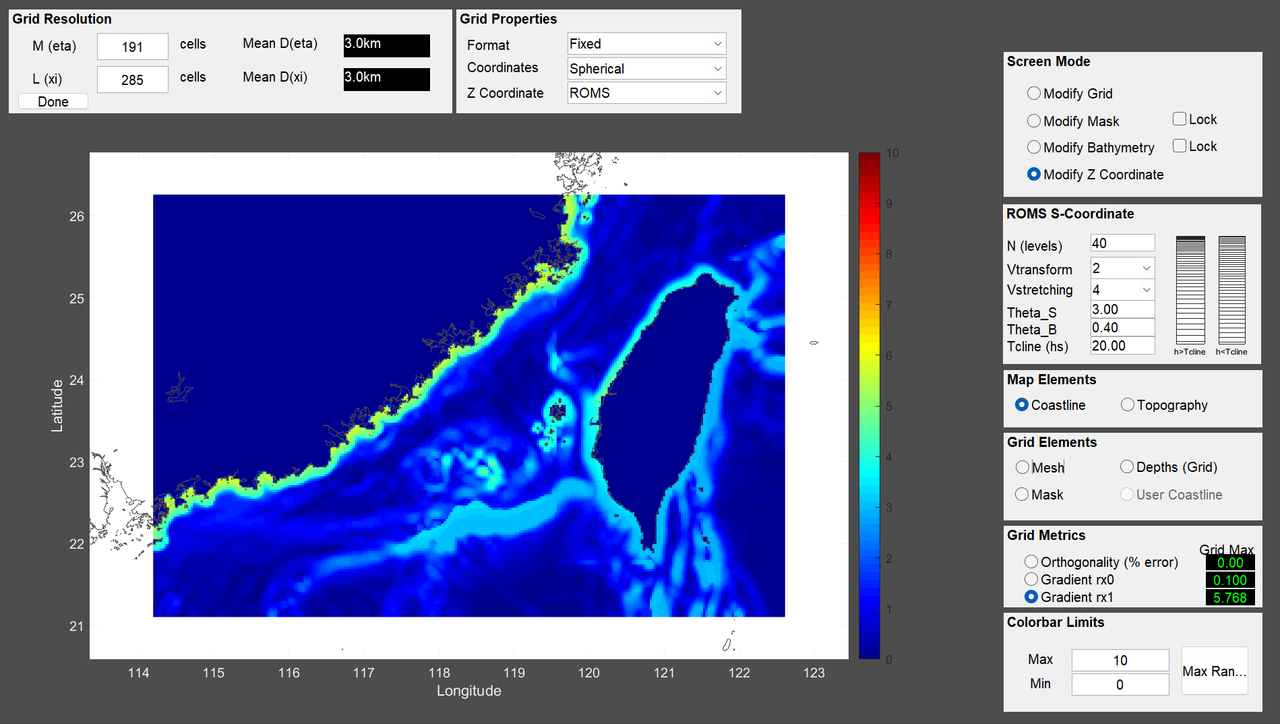
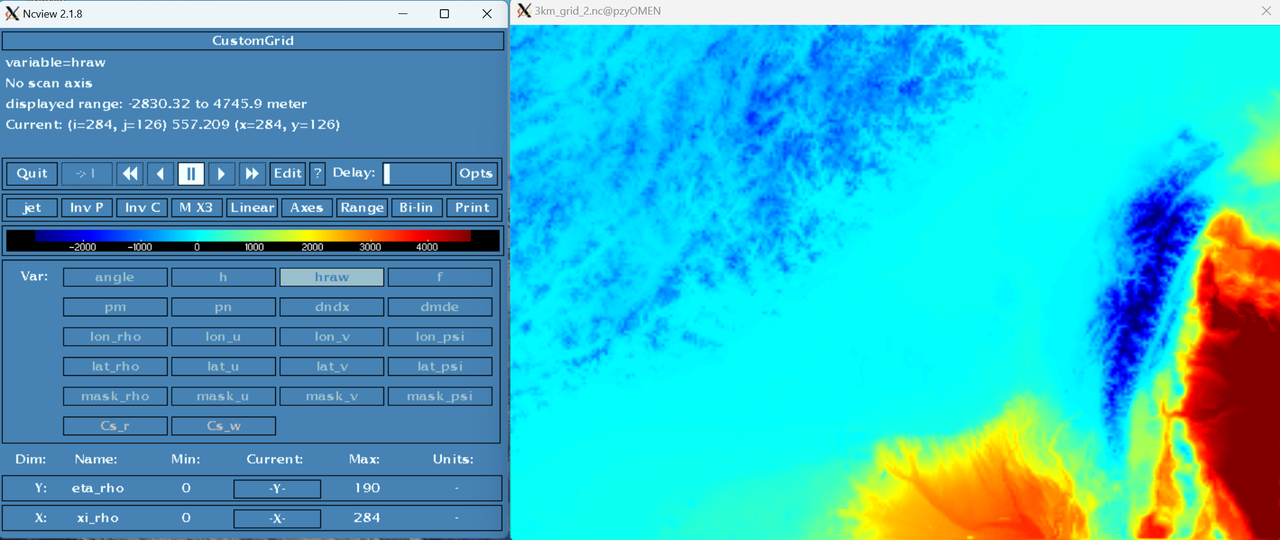
First, a well-behaved terrain reduces the potential risk of model blowup. GridBuilder is really a powerful tool for generating ROMS grids, and I also wrote a matlab script to modify the land elevation of the generated grid to the minimum water depth, and made appropriate smoothing in the place where the slope of the terrain changed too much, and got a grid with good performance of various parameters - it was not overly smooth, and the grid stiffness and orthogonality were not crazy.

Image


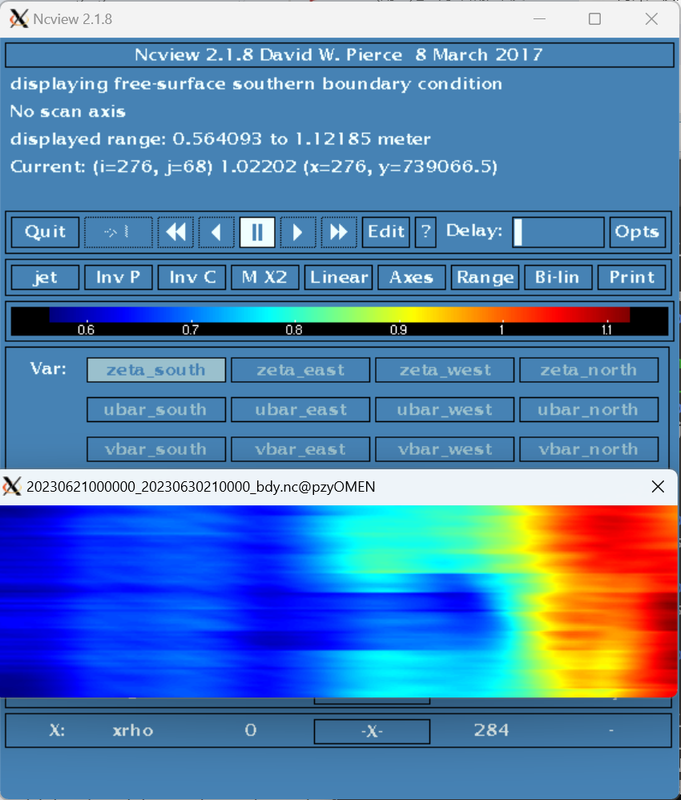
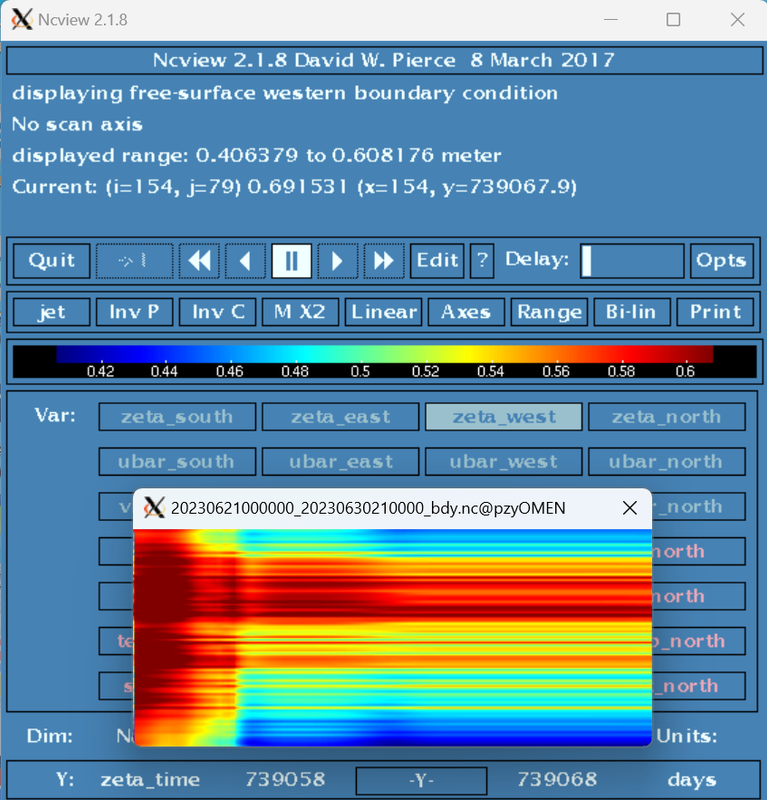
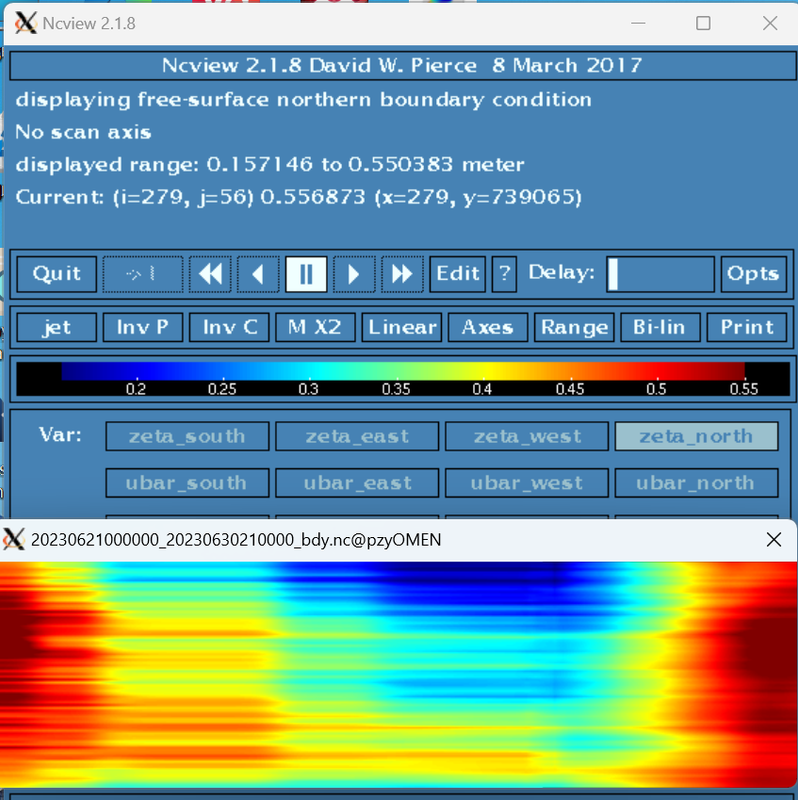
I then used roms_clm/roms_master_climatology_coawst_mw.m to make ini, bdy and clm files (from hycom), and used my own script with mtools/create_roms_forcings to generate the surface force file (source ERA5). I have carefully examined these files and found that the zeta data seems to be somewhat discontinuous(shown below)... I'm not sure if this is the hycom dataset as it is or if there was an error in my interpolation process.
Image

Image

Image


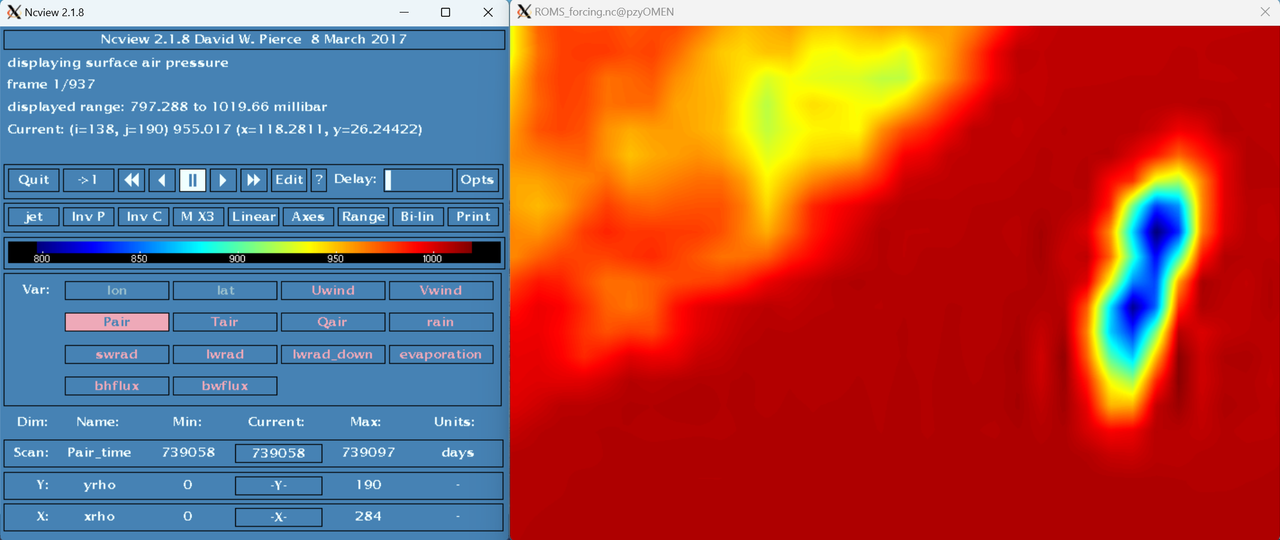
I now have a delicate problem: as stated earlier, I changed all the land elevation in the grid to the minimum water depth (hmin = 5m in my example), because as far as I know, the ROMS calculates all the points in the model domain and then masks out the result of the land. Therefore, in the model domain, no h < 0 can occur. What makes me uneasy, however, is that there are actually some very high mountains in my model domain, and the ERA5 data shows that the pressure in these places is much lower than the typical value of 1000mb at sea level. Since my forcing files are interpolated from ERA5 data in the grid, could these false low pressures be a potential cause of ROMS blowup?

Image

Image

Image


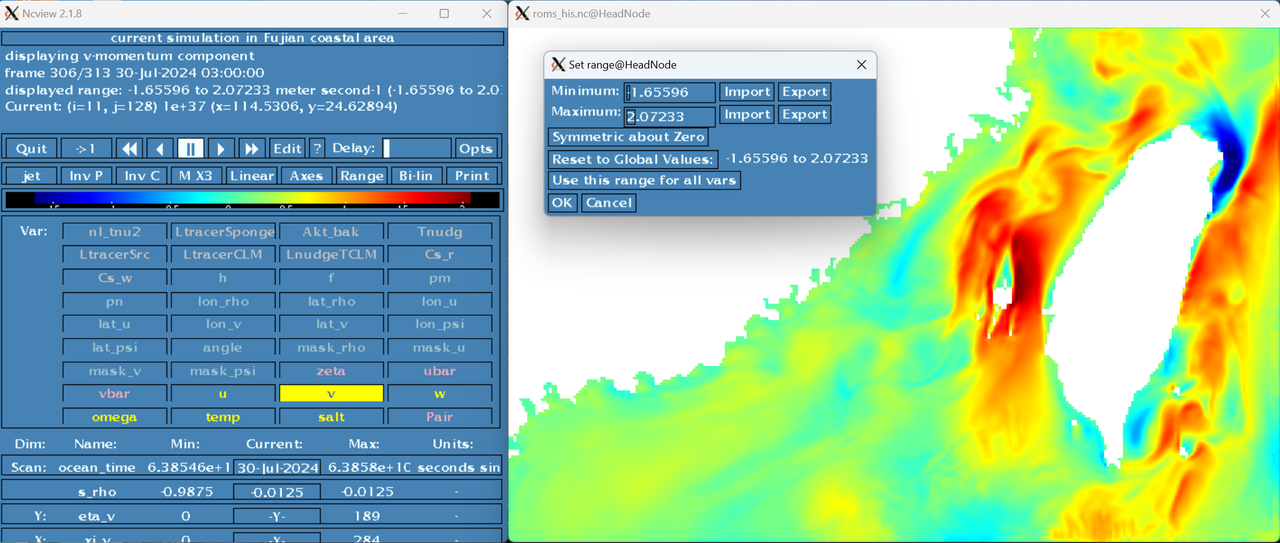
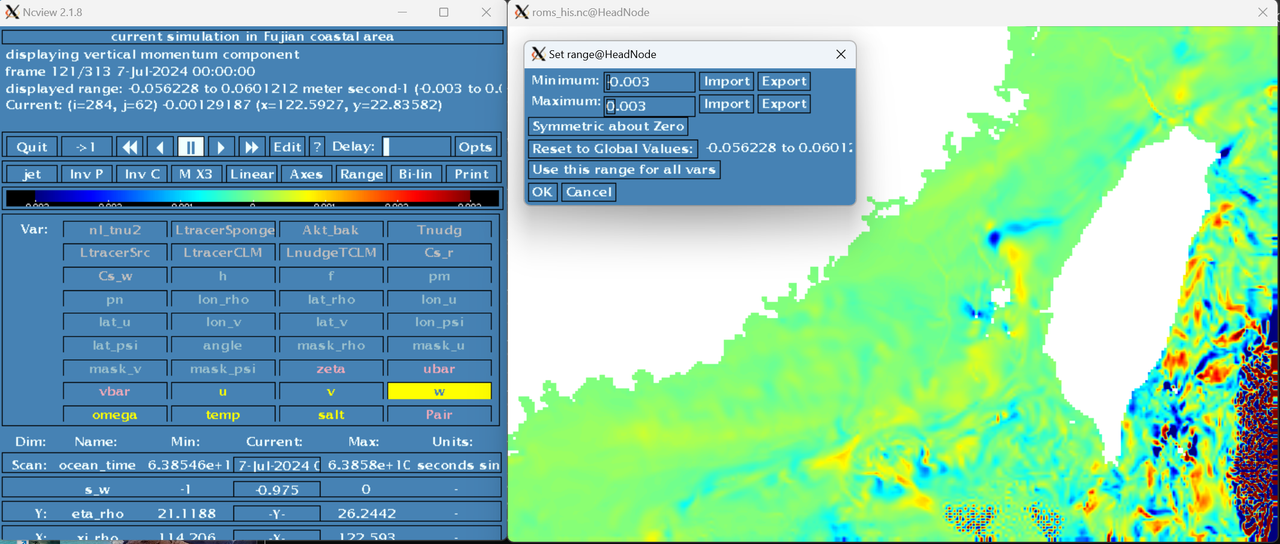
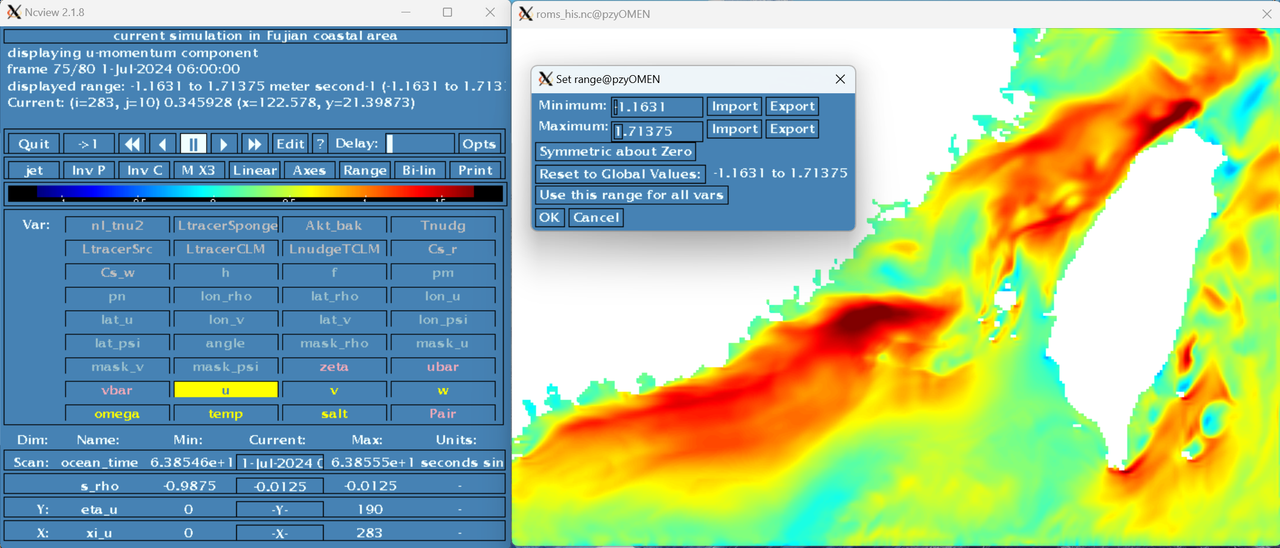
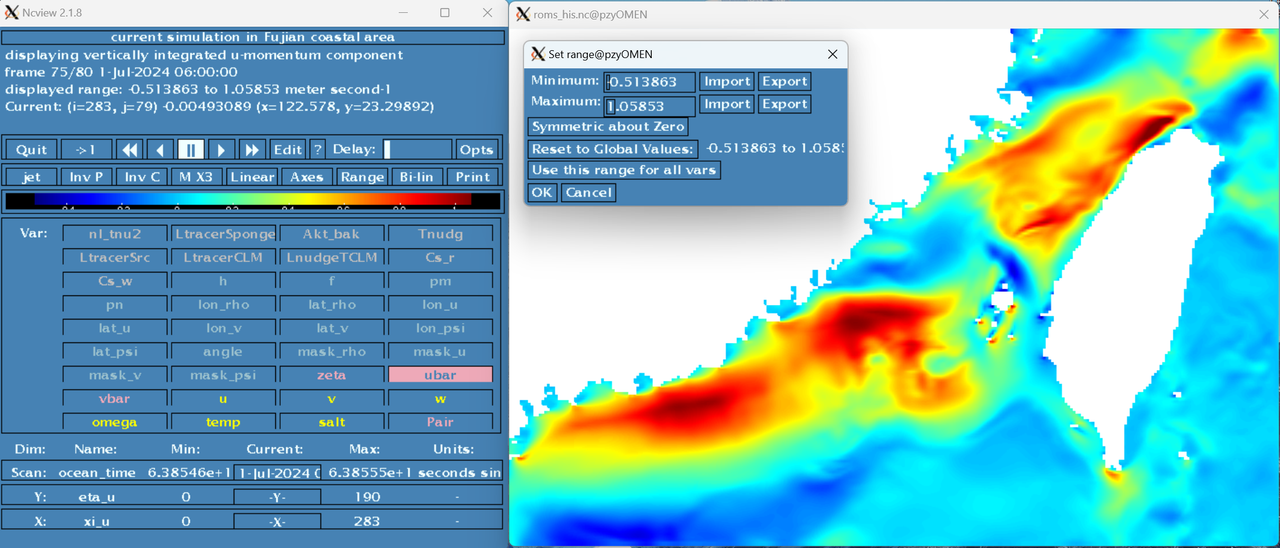
Finally, I ran a real case for ten days, and although it ran smoothly, I found that the maximum of the horizontal flow field far exceeded that of the real ocean, and there was vertical flow noise in the bottom ocean near the eastern boundary. What are the underlying reasons for this phenomenon? Should I try to improve the flow behavior at the boundary with nudge and sponge? I also tried to enable UV_U3ADV_SPLIT and UV_VIS4 to improve fake mixing, but without success. Also, my maximum 2D uv speed can reach 1, which doesn't seem very normal either.
Image

Image

Image


My operation log and various files are attached below. Any kind reply would be most appreciated. :D
Attachments
roms.log
(2.33 MiB) Downloaded 11 times
roms.in
(143.16 KiB) Downloaded 10 times
roms.h
(1.17 KiB) Downloaded 9 times

Study_fish
Posts: 23
Joined: Thu Sep 21, 2023 2:52 pm
Location: Sun Yat-sen University

Re: noisy vertical velocity in deep bathymetry and uv with high value

#2 Unread post by Study_fish »

I took further steps to improve my run.

1. I tried to add the nud.nc to improve my boundary conditions, although I don't know if it's really a problem. I set outer = 1/5, inner = 1/60, and width = 8 by using d_nudgcoef.m to generate a nudge file with linearly reduced nudgcoef from the boundary to the model's internal field. After adding this file, the model was able to run stably for longer, but eventually blew up after 39 days.

2. I also tried to shorten the time step from 180s to 150s, but this did not make a significant difference and the model still blew up on day 39. Given that my spatial resolution is 3km, I don't think further narrowing the time step will help much.

The main problem I am facing now is that the temperature and salinity field shown in his.nc seem to have no big problems, but the velocity is generally too large, and the maximum value can reach 2m/s. Next, I might try it in two directions: enlarging the nudge region, for example, by making width = 10, and making the outer and inner time scales shorter, bringing them closer to the 3D climatology; Or try to increase the drag coefficient and reduce the velocity. I'll show my results later.

If I do something unreasonable or have any better suggestions for improvement, I sincerely hope that all ROMS experts will remind me.I have attached the roms.log of the latest run below.
Attachments
roms.log
(10.23 MiB) Downloaded 15 times

Study_fish
Posts: 23
Joined: Thu Sep 21, 2023 2:52 pm
Location: Sun Yat-sen University

Re: noisy vertical velocity in deep bathymetry and uv with high value

#3 Unread post by Study_fish »

The latest running were successfully completed, and it seems that expanding the nudging area and increasing the drag coefficient can help. But I still have a few questions:

1. in my .in file, my timestamp is set as follows:
! Time-stamp assigned for model initialization, reference time
! origin for tidal forcing, and model reference time for output
! NetCDF units attribute.

DSTART = 739058.0d0 ! days
TIDE_START = 0.0d0 ! days
TIME_REF = 00000100.0d0 ! yyyymmdd.dd
This means that I want to use matlab canlendar to represent the time the pattern runs, not Julian Day or modified Julian Day. The time period I want to simulate is 2023/06/21/00-2023/07/30/00. As far as I know, the start time of matlab is 0000-01-00 00:00:00, and the datenum function is used to represent 2023.06.21.00 to get the result 739058:
>> datenum(0000,01,000,0,0,0)

ans =

0

>> datenum(2023,06,21,0,0,0)

ans =

739058
So, is there something wrong with my Settings? Why is my roms.log showing that the model is running from 2024-06-22?

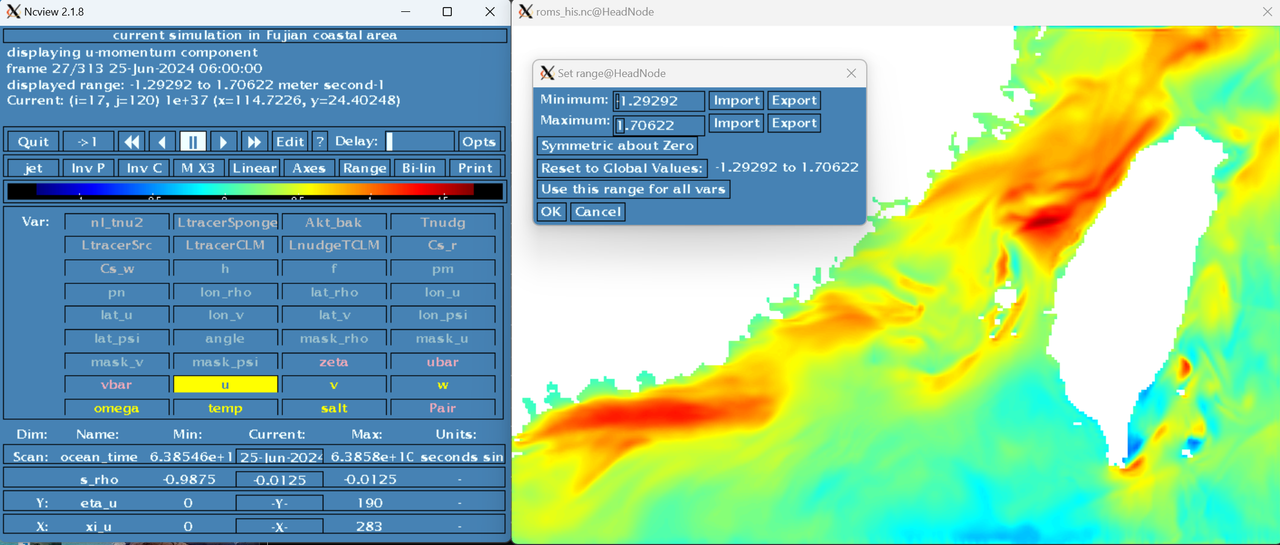
2. The results show that the temperature and salinity fields are relatively normal, but the flow velocity fields still show some surprisingly high values: for example, the maximum u can reach 1.7m/s, and the maximum v can reach 2m/s. Compared with the maximum values corresponding to HYCOM (u~0.8m/s, v~1.5m/s), it seems somewhat abnormal, considering the data assimilation of HYCOM data, I think my running result is barely acceptable. Do you have any idea about it?

Image

Image

3. In fact, what is more difficult to accept than horizontal uv is the performance of vertical velocity w. I found a spurious strong vertical mixing at deeper water depths, especially at the southeastern boundary, where maximum flow rates could reach 10-2m/s! Considering that the maximum magnitude of upwelling is only in the order of 10-3m/s, I have no idea why this phenomenon occurs. Do you have any better suggestions ROMS experts? If necessary, I will provide you with more details for diagnosis.

Image
Attachments
roms.log
(9.78 MiB) Downloaded 19 times

User avatar
wilkin
Posts: 884
Joined: Mon Apr 28, 2003 5:44 pm
Location: Rutgers University
Contact:

Re: noisy vertical velocity in deep bathymetry and uv with high value

#4 Unread post by wilkin »

Your choice of reference time is not recommended. See viewtopic.php?p=119#p119

Since you are working with MATLAB, you can easily convert a chosen reference time to datenum convention

In ROMS, e.g.:
TIME_REF = 20240101.00

In MATLAB:
>> dnum = datenum(2024,1,1) + ocean_time/86400;

But in MATLAB, consider using the datetime object instead. It's much more versatile.
John Wilkin: DMCS Rutgers University
71 Dudley Rd, New Brunswick, NJ 08901-8521, USA. ph: 609-630-0559 jwilkin@rutgers.edu

Study_fish
Posts: 23
Joined: Thu Sep 21, 2023 2:52 pm
Location: Sun Yat-sen University

Re: noisy vertical velocity in deep bathymetry and uv with high value

#5 Unread post by Study_fish »

Thanks for your reply wilkin. I'll look into it.

wenpuho
Posts: 1
Joined: Thu Dec 16, 2021 9:37 pm
Location: National Central University

Re: noisy vertical velocity in deep bathymetry and uv with high value

#6 Unread post by wenpuho »

Just my two cents:

1. Be careful when interpolating from the global atmospheric data, especially near the coastal region. Meteorology field can be significantly different between neighboring grids. ERA5 provides well-documented definitions for land/sea grids (https://confluence.ecmwf.int/display/FU ... d-Sea+Mask).

2. Base on your research purpose, are isolate islands important to consider? If not, how about manually mask them as the ocean?

3. Have you checked the B.C. of southeast? ROMS diagnoses the vertical velocity from uv, where uv are calculated from the pressure field derived from t, s and zeta. I would advise you to carefully check each field step by step.

Study_fish
Posts: 23
Joined: Thu Sep 21, 2023 2:52 pm
Location: Sun Yat-sen University

Re: noisy vertical velocity in deep bathymetry and uv with high value

#7 Unread post by Study_fish »

Thank you wenpu. Very nice suggestion. I will try these suggestions slowly. If these makes my running better, I will show it.

Study_fish
Posts: 23
Joined: Thu Sep 21, 2023 2:52 pm
Location: Sun Yat-sen University

Re: noisy vertical velocity in deep bathymetry and uv with high value

#8 Unread post by Study_fish »

I recently went over my bdy and clm.nc and unfortunately they all seem to be in order, especially at the eastern and southern boundary. I don't know if I'm reading this wrong, but the presence of such a large vertical velocity at the near bottom of the southern boundary is really puzzling to me. I attach my bdy, clm and forcing.nc here, and I sincerely hope that you can help me to make a diagnosis :D
Attachments
ROMS_forcing.rar
(1.41 GiB) Downloaded 11 times
bdy and clm in first 10 days.rar
(1.79 GiB) Downloaded 9 times

User avatar
arango
Site Admin
Posts: 1351
Joined: Wed Feb 26, 2003 4:41 pm
Location: DMCS, Rutgers University
Contact:

Re: noisy vertical velocity in deep bathymetry and uv with high value

#9 Unread post by arango »

To me, the behavior of vertical velocity near the open boundary is the byproduct of the lateral boundary conditions. Recall that in ROMS, the vertical velocity (omega) is an expression of the 3D continuity equation computed by the horizontal divergence. There must be some vertical biases in your climatology and boundary data that cause such behavior. This is deep water, and there may be a water masses mismatch between the model and data that causes such a violent response to equilibrium.

Are you applying a sponge region next to the open boundary conditions?

Study_fish
Posts: 23
Joined: Thu Sep 21, 2023 2:52 pm
Location: Sun Yat-sen University

Re: noisy vertical velocity in deep bathymetry and uv with high value

#10 Unread post by Study_fish »

Thanks for your reply arango! Yes, as you said, the vertical velocity is calculated from the three-dimensional continuity equation by the horizontal divergence. The water mass mismatch between the model and the data should be the main reason for the abnormally high omega values in the deep water.

You also mentioned sponge. It occurred to me that warner had suggested this before, but I didn't use sponge because I didn't know much about it. By reading add_sponge.m, I found that if I want to apply sponge to a specific area, I need to enter the corresponding visc_factor and diff_factor. For my example, I set VISC2 == 5.0d0 and TNU2 == 2*0.0d0, so how should the corresponding visc_factor and diff_factor be set? Could you give me some advice? :oops:

Study_fish
Posts: 23
Joined: Thu Sep 21, 2023 2:52 pm
Location: Sun Yat-sen University

Re: noisy vertical velocity in deep bathymetry and uv with high value

#11 Unread post by Study_fish »

Hey guys, I've got a new problem.

now I would like to try to run ROMS by adding wave data to my forcing.nc to see wave effects on current. To do this, I defined CPP:
#define WEC_VF
#define WDISS_THORGUZA


and I added wec boundary condition to .in file:
! Wec boundary conditions
LBC(isU2Sd) == Shc Shc Shc Shc ! 2D U-stokes
LBC(isV2Sd) == Shc Shc Shc Shc ! 2D V-stokes
LBC(isU3Sd) == Rad Rad Rad Rad ! 3D U-stokes
LBC(isV3Sd) == Rad Rad Rad Rad ! 3D V-stokes
However, when I started running, something strange happened, the ROMS seemed to have an error reading the lateral boundary condition, and when I looked at the log file, I found:
ubar_stokes 1 a ðaUbU ^@^@^@^@^@ ^@ @^@ @^@ @^@ @ Nud Rad + Nud Rad + Nud
vbar_stokes 1 Shchepetkin Shchepetkin Shchepetkin Shchepetkin
u_stokes 1 Shchepetkin Shchepetkin Shchepetkin Shchepetkin
v_stokes 1 Radiation Radiation Radiation Radiation
...
===================================================================================
= BAD TERMINATION OF ONE OF YOUR APPLICATION PROCESSES
= PID 97058 RUNNING AT HeadNode
= EXIT CODE: 139
= CLEANING UP REMAINING PROCESSES
= YOU CAN IGNORE THE BELOW CLEANUP MESSAGES
===================================================================================
YOUR APPLICATION TERMINATED WITH THE EXIT STRING: Segmentation fault (signal 11)
This typically refers to a problem with your application.
Please see the FAQ page for debugging suggestions
I look for previous posts. It seems that no one has made such errors as me. Do you have any ideas?
Attachments
withwave.in
(143.52 KiB) Downloaded 7 times
roms.log
(67.65 KiB) Downloaded 7 times

Post Reply