Left side of the upwelling example

General scientific issues regarding ROMS

Moderators: arango, robertson

Post Reply
Message
Author
User avatar
drews
Posts: 35
Joined: Tue Jun 19, 2007 3:32 pm
Location: National Center for Atmospheric Research
Contact:

Left side of the upwelling example

#1 Unread post by drews »

I have plotted the flow vectors in a cross section of the upwelling example. Everything looks fine except for the left (south) side of the channel. Recall that the wind here is into the page and the Coriolis force is to the left (southern hemisphere). Here is the entire section:
Image

As you can see, there is some complexity on the left side. Here is the detail:

Image

Is that Kelvin-Helmholtz instability over there? Induced by the vertical shear between the surface current and the return bottom current in the shallows? Or do I have some numerical error in my Python code:

http://acd.ucar.edu/~drews/plotSection.py

Carl

User avatar
kate
Posts: 4088
Joined: Wed Jul 02, 2003 5:29 pm
Location: CFOS/UAF, USA

#2 Unread post by kate »

Hi Carl,

It's likely that there is some alternating up and down flow. You can check for sure by plotting vertical velocity with contours. Now, there's the question of direction on vectors. Ideally, if the flow is along the sloping bottom, you would want your vectors to be parallel to the sloping bottom. You have some shooting out of the bottom in the big picture, then lifting up off the bottom in the zoom in. They can't both be right.

jpringle
Posts: 107
Joined: Sun Jul 27, 2003 6:49 pm
Location: UNH, USA

#3 Unread post by jpringle »

Carl-

The upwelling code is define to use a constant value of vertical mixing, as you can tell from this code in upwelling.h
#if defined GLS_MIXING || defined MY25_MIXING
# define KANTHA_CLAYSON
# define N2S2_HORAVG
#else
# define ANA_VMIX
#endif
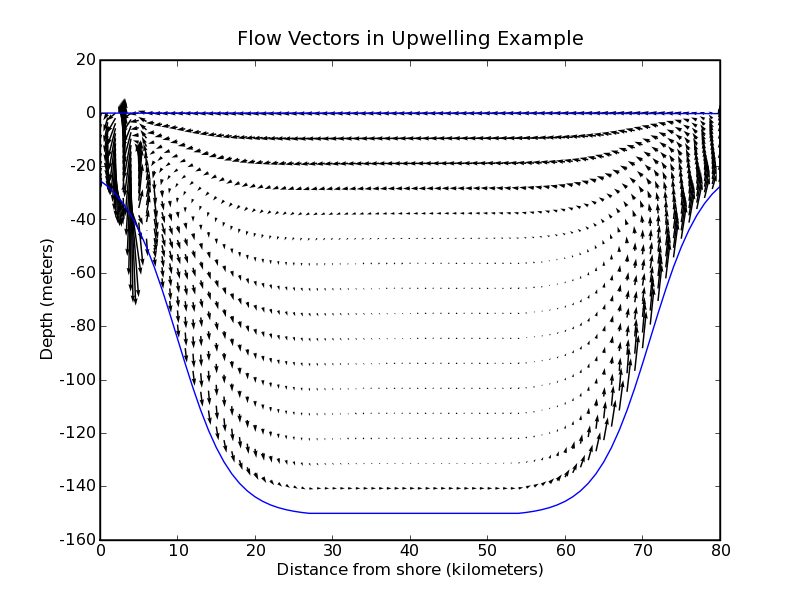
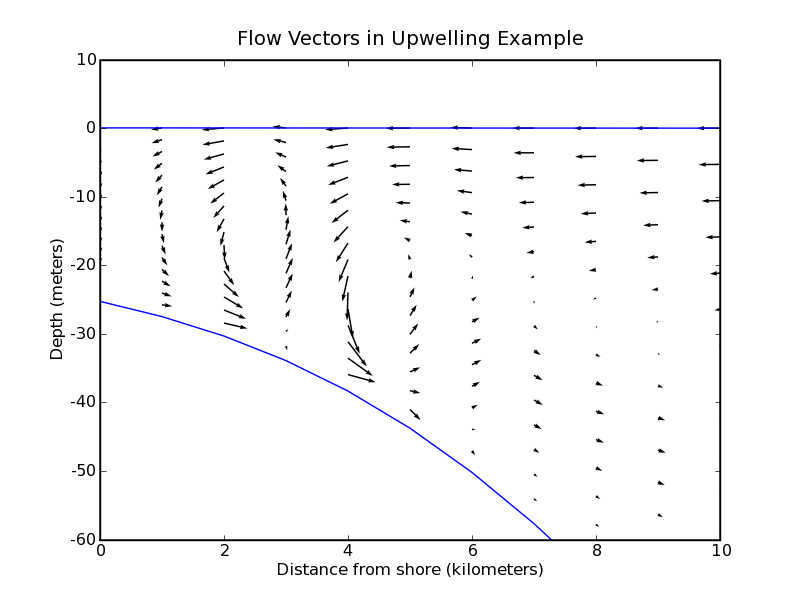
and by noting that neither GLS_MIXING or MY25_MIXING are enabled earlier in the file. Furthermore, on the side of the "upwelling" model case in which there is downwelling, the left side in your plot, light water is being forced under denser water. This leads to a static instability in the water column. With a low and constant viscosity, this leads to convection in the model.

Unfortunately, in a relatively coarsely resolved hydrostatic model, this convection is poorly represented as 2 Delta X upwelling cells, as you see in your plot. To model the convection properly, you would need a horizontal resolution that is small compared to the water depth (!!) and a non-hydrostatic model. This will tend to be computationally unfeasible if you want to use the model to resolve any reasonably large area. Thus you must parameterize convection. MY25_MIXING will do an ok-ish job of doing this by cranking up the eddy viscosity. See Austin & Lentz's paper on the inner shelf for a discription of how the inner shelf will develop in a case like that shown in the "upwelling" model case.

P.s. how well developed is your python plotting code for ROMS output -- is it good enough to share?

Cheers,
Jamie Pringle
University of New Hampshire

User avatar
drews
Posts: 35
Joined: Tue Jun 19, 2007 3:32 pm
Location: National Center for Atmospheric Research
Contact:

That Python code

#4 Unread post by drews »

Jamie -

Thanks for the information about mixing and convection. Your comments will be useful to me, since my research involves shallow water.

That Python code is a quick-and-dirty script that I put together to produce a plot. I posted it in case someone needs to review my processing to answer my question. The code contains too many hard-wired numbers and too much debugging. It's okay to share for someone who is new to Python, or who wants to see how to read NetCDF and put up a basic plot, but I would not consider it to be well-engineered code. "No warranty implied." But it might be useful to those who are learning.

Carl

Post Reply