How to diagnose blow-ups with wetting/drying

General scientific issues regarding ROMS

Moderators: arango, robertson

Post Reply
Message
Author
csherwood
Posts: 39
Joined: Fri Apr 02, 2004 4:46 pm
Location: USGS, Woods Hole, USA

How to diagnose blow-ups with wetting/drying

#1 Unread post by csherwood »

I have been trying to solve a blow-up with wetting and drying. The bathymetry has terrible metrics, according to the output:

Code: Select all

 Maximum grid stiffness ratios:  rx0 =   1.960000E+02 (Beckmann and Haidvogel)
                                 rx1 =   1.466021E+04 (Haney)
However, I don't think this is the problem. For one thing, I am not sure these metrics are correct when used with bathymetry with both positive and negative values. (This is the Teignmouth case, with tide range of >4 m). I have added constant offset to the depth (to make it all positive), smoothed the bathymetry to a maximum rx0 of 0.3 (using Mathieu's LP_Bathymetry package), and then removed the offset. Mathieu's GRID_RoughnessMatrix.m file returns max rx0 of 0.3 when the offset is added, but approaches ~200 after the offset is removed, mostly on the edges of the estuary channel. Anyway, I don't think that is the problem, because the blow-up is not associated with the steeper parts of the bathy grid, it is on one of the flanking sandbars. Also, the model blew up at exactly the same spot and time step AFTER smoothing the bathymetry, which makes me think that is not the problem.

It appears as a NaN in u and v at the margin of a cell that is going dry. (White spot in ncview image).
teign_ocean_rst_v.png
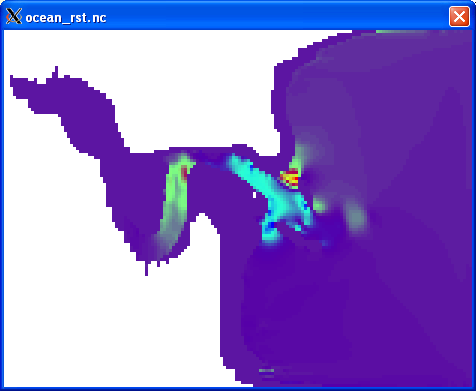
teign_ocean_rst_v.png (12.8 KiB) Viewed 3109 times
I am doing a run with a changed tiling scheme and an increased Dcrit to see if that changes things. Any other suggestions?
Chris Sherwood, USGS
1 508 457 2269

csherwood
Posts: 39
Joined: Fri Apr 02, 2004 4:46 pm
Location: USGS, Woods Hole, USA

Re: How to diagnose blow-ups with wetting/drying

#2 Unread post by csherwood »

Update on this problem: another run, with DCRIT increased to 0.5 m and tiling switched runs a little longer, and blows up in a different spot (steep channel edge as water level is rising). The location is not close to a tiling boundary.
Chris Sherwood, USGS
1 508 457 2269

abever
Posts: 23
Joined: Tue Feb 17, 2004 6:15 pm
Location: Anchor QEA, LLC

Re: How to diagnose blow-ups with wetting/drying

#3 Unread post by abever »

If it is a ROMS/SWAN coupled configuration try looking at the waves and stokes velocities. They may not depend strongly on the fine scale changes in the grid making it not very sensitive to smoothing the grid. If something is happening making the gradient in the waves high it might cause a blow-up because of unreasonable velocities, similiar to the problem I was having earlier.

User avatar
kate
Posts: 4088
Joined: Wed Jul 02, 2003 5:29 pm
Location: CFOS/UAF, USA

Re: How to diagnose blow-ups with wetting/drying

#4 Unread post by kate »

If you at all suspect a parallel tiling issue, I would run with two different tilings and no other changes, then run ncdiff on the two outputs. If anything turns up, fix that first.

csherwood
Posts: 39
Joined: Fri Apr 02, 2004 4:46 pm
Location: USGS, Woods Hole, USA

Re: How to diagnose blow-ups with wetting/drying

#5 Unread post by csherwood »

Update: A simple case (no waves or sediment transport) with the smoothed grid (see note below) now runs to completion, with a tidal range of ~4 m.
Neil Ganju suggested changing the s-levels (He da man!). New values are: theta_s = 1; theta_b = .8, tcline = 0.

In addition, we switched from UV_QDRAG to UV_LOGDRAG and set both zos and zob to 0.004 m, in hopes of keeping them < 1/2 layer thick in dry cells, where DCRIT = 0.1 m. Maybe the zos and zob changes were pure superstition.

Note: This is the version with the smoothed grid, where rx0 = ~200 according to ROMS and Mathieu when both positive and negative depths are included, but is actually max rx0 = 0.3 after the depths are made all positive by adding 7 m prior to calculating rx0. I am even more sure that the formula for calculating rx0 needs to use the absolute value of h in the denominator when negative depths (i.e. regions above mean water level) are present.

We don't think the problem was related to tiling.

Of course, we changed several things at once, so we aren't sure which one was key to getting it to run, but we will do some runs to find out. Stay tuned.
Chris Sherwood, USGS
1 508 457 2269

Post Reply